
Measure the quality of the air around us using a laser technology sensor that can quantify the concentration of the infamous micro-dust.
Air pollution, and in particular the presence, quantification and concentration of so-called ‘fine dust’, is a very topical problem, especially in large urban agglomerations and near the large industrial areas bordering large cities.
To measure air quality, there are solutions based on complex instruments equipped with specific sensors and on the analysis stations we see in city streets, installed on poles or on-board vehicles parked by the side of the roads.
Alongside these devices, which we might call professional (or institutional, if you prefer), there is a long line-up of cheaper detectors that are affordable for the general public who want to carry out their own analyses without the ‘impèrial’ seal, but still with reliable results.
In this article we will introduce you to such a device, the SDS011 laser sensor, and describe how to use it to measure the air quality in the environment in which we live, displaying the results of the measurement on a Personal Computer.
The SDS011 sensor is able to detect and measure concentrations of solid and liquid particles suspended in the air, known as Particulate Matter-PM, classified by size up to 2.5 µm and up to 10.0 µm, in technical jargon referred to as PM2.5 and PM10 respectively.
Some particles are large enough to be visible to the naked eye while others are microscopic. It is precisely the smallest particles that are of interest as they are easily inhaled and therefore taken up by the human body.
Once they enter the breathing cycle, if the concentration of these particles is long-lasting and high enough, they can produce harmful effects on health. We have said that particulate matter is classifiable according to the size measurable in micrometers, more precisely the measurement of the diameter of the particles, but since what is of most interest is to detect the amount of these particles, i.e., their concentration in the air, the unit of measurement adopted for the evaluation of the concentration in the air is that of micrograms per cubic metre (µg/m²).
To give you an idea of the concept, Fig. 1 illustrates the size comparison in micrometres between particles of different natures; it is interesting to observe the size of a grain of sand, on average about 90 µm, in comparison with the size of PM2.5 and PM10 particles.
Particulate matter in the environment is generated by natural and human processes; monitoring air pollution caused by human activities is an important indicator of air quality. In many applications related to human wellbeings, such as ventilation, air conditioning, air purification and filtration systems, monitoring of PM2.5 and PM10 particle concentrations is a must to ensure that these well-being applications do not turn into harmful health effects.

Fig. 1
Table 1 shows the CAQI air quality indicators and the corresponding values in μg/m3 of the concentrations of O3 (ozone), NO2 (nitrogen dioxide) and PM2.5 and PM10 particulate matter. The CAQI, short for Common Air Quality Index (CAQI), is an air quality index used in Europe since 2006. In November 2017, the European Environment Agency announced the European Air Quality Index (EAQI) and in order to inform the public about air quality, it started to encourage its dissemination on websites and other media.

The CAQI is a numerical value on a scale of 1 to 100, where a low value means good air quality while a high value is indicative of poor air quality. The first column on the left of the table shows five air quality levels, corresponding to the five coloured bands of CAQI air quality indicator values. In the four columns next to the CAQI indicators, the corresponding standard values of airborne pollutants are specified.
The laser particle sensor
Having defined what micro-dust and particulate matter are and what methods are used to determine their concentration and significance in terms of the goodness of the air, we move on to explain the technique used to operate the sensor used in the project we are presenting: the laser technique.
A laser sensor is an integrated device consisting essentially of the following elements: a laser light source, a detection chamber, a photodiode, a microcontroller, a communication interface and a fan to suck in the air to be analysed, which basically serves to take samples and bring them into the detection chamber.
The concentration of particulate matter in the air is measured by counting particles using the light scattering method. Fig. 2 shows the principle diagram of the operation of a laser sensor for measuring the concentration of PM2.5 and PM10 particles.
The light emitted by the laser illuminates the particles, which are collected by the sensor by means of external air suction operated by the internal fan. The particles are then transported and injected into the detection chamber. In the detection chamber, there is a photodiode, which converts the detected brightness level, modulated by the particle concentration, into a corresponding voltage value, resulting from the fluctuations of the reverse current due to the laser light.
The values that the voltage takes on as a function of the concentration of particles hit by the laser light, acquired and converted into digital values, are analysed and processed by a microcontroller. Finally, the results of the analysis and processing are made available to a communication interface.
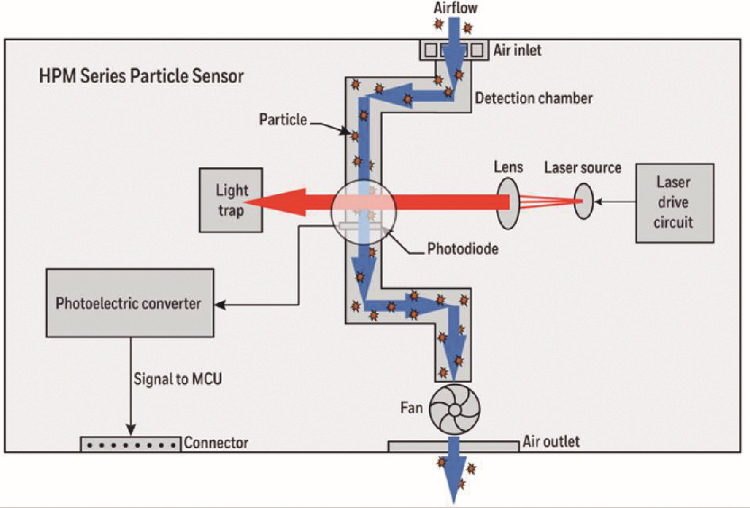
Fig. 2
The SDS011 laser sensor
The SDS011 sensor has a high degree of integration, as it contains all the elements needed to create a high-precision laser sensor.
The SDS011 consists of the following elements: a laser diode, a photodiode, a microcontroller, a low-noise photodiode signal amplifier, an air suction fan and a communication interface that enables the measurement result to be transformed into pulses at a logical level.
To measure the concentration of PM2.5 and PM10 particles, the “light scattering” method is used, using a laser light source. Other types of sensors also use the “light scattering” method, but with the use of infrared diodes in order to reduce production costs, but it is certainly the use of the laser that guarantees greater measurement accuracy compared to these IR LED sensors.
The use of lasers in the SDS011 makes it possible to detect concentrations of particles ranging from 0.3 to 10 microns in diameter. The measured data are therefore stable and reliable. Fig. 3 shows the SDS011 compact module whose dimensions are 71×70 mm, and a thickness of 23 mm.
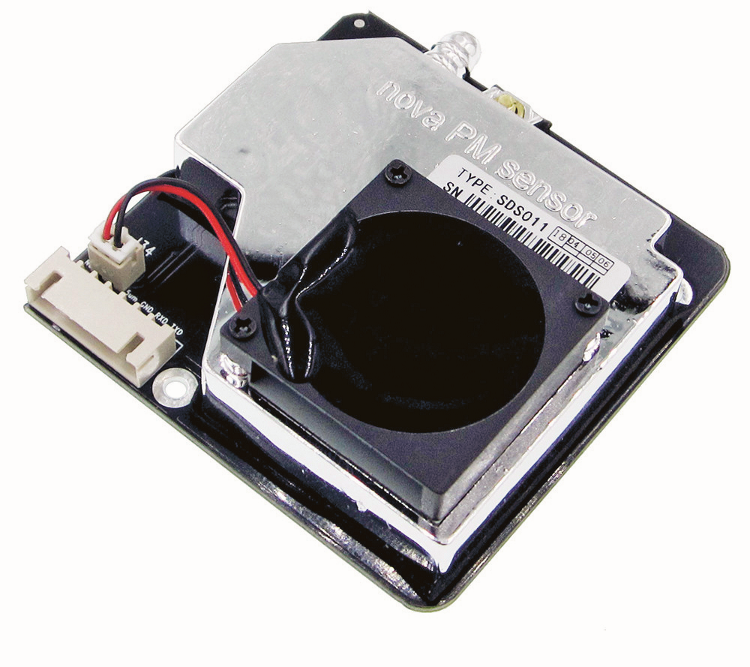
Fig. 3
Table 2 shows the technical characteristics of the SDS011. Note the high measurement range of 0 to 999 µg/m3 and the 0.3-micron resolution of particulate detection.

Table 3 shows the pin numbering of the SDS011 module connector, from which power is applied and on which the communication interface is located.

The communication interface
SDS011 can send PM measurement data externally, i.e., to a PC, microcontroller, etc., via the communication interface.
From Table 3, concerning the description of SDS011 pins, we can see that PM2.5 and PM10 measurement data can be collected through the measurement of PWM output pulse signals and the UART serial communication interface.
Concerning the measurement of PWM signals the concerned pins are: pin 2 “1um” for PM2.5 particulate measurement and pin 4 “25 µm” for PM10 particulate measurement.
Basically, with constant pulse repetition frequency, the pulse width measurement of the PWM signal determines the µg/m³ value of the particulate matter. Fig. 4 illustrates the concept in graphic form.

Fig. 4
Table 4 lists the parameters of the PWM output signals. The UART serial interface is the communication system we are interested in, as we will use it to collect and send the PM measurement data to the PC. The UART communication protocol of the SDS011 must be set on the PC with these communication parameters: bit rate of 9600 bps, 8-bit data, no parity bit, one stop bit.
4 
Referring again to Table 3, the pins involved in the UART connection are: pin 6 “R” RX TTL and pin 7 “T” TX TTL. Table 5 lists, in progressive numerical order of transmission, the bytes of digital values of PM2.5 and PM10 measurement results that the SDS011 UART serial communication interface transmits to the PC UART.

PM2.5 and PM10 measurement set-up with the SDS011 and the PC
The PM2.5 and PM10 measurement system requires hardware and software. For the hardware, you simply need an SDS011 module, a USB-to-serial converter and a PC. The SDS011 module can be purchased from our store (Product Code: 8300-PMSENSOR) and also includes the USB-to-serial converter.
As far as the software is concerned, it is possible to download the compressed files “Nova PM2.5 Sensor Software-En-V1.88.zip” of the program for displaying graphs of the measurement results and “CH341SER.zip” of the driver of the USB-to-serial converter from the site www.open-electronics.org.
Once the hardware and the software are available, the first step is to connect the SDS011 module connector to the USB-serial converter connector, then connect the USB connector of the USB-serial converter to a PC USB port.
Once the hardware is connected, proceed with the software installation, starting with the USB-to-serial converter driver installation by unpacking the “CH341SER.zip” file and launching the “setup.exe” executive file.
Before proceeding with the installation of the programme, it is necessary to ensure that the USB-to-serial converter driver has been successfully installed. To do this, simply go to the PC’s peripheral management and check that in the “Ports (COM and LPT)” list there is a USB-to-serial COM port identifiable by the name of the CH341SER driver, as shown in Fig. 5, which in the example is COM13.

Fig. 5
Subsequently, the SDS011 management programme for measurement data acquisition and display is installed by unpacking the “Nova PM2.5 Sensor Software-En-V1.88.zip” file and launching the “SPM25Data.exe” file.
When the program is started, the SDS011 sensor configuration screen will appear on the PC monitor as shown in Fig. 6. The programme will identify the connected sensor device that will appear at the top of the device list, or, if not present, select it manually from the list.
The programme will automatically detect also the communication port, for example, COM13, through which the serial communication between PC and SDS011 sensor will take place.

Fig. 6
Once COM port appears in “Com List”, press “Add>>” button to associate it to SDS011 sensor in “Device List”. In case no COM port is present in the “Com List”, it is possible to search for a COM port manually by selecting “Manually serial port” button, then select the device in “Device List” and the corresponding serial port that appears in “Com List”, as shown in Fig. 6.
Finally, click on “Add>>”. Once the configuration of the sensor device association to the COM port is finished, click on “OK” to start the measurement program. By default, the PC screen will show the graph of the time course of the PM2.5 values in µg/m³ (Fig. 7).

Fig. 7
Note, with the full-scale set at 30 µg/m³, the very low values of PM2.5, less than 4 µg/m³, reveal very good air quality in the measured environment, i.e., values contained within the range 0-15 µg/m³ relative to the band of low PM2.5 values in Table 1 of the European air quality values. From the “Display Mode” list, select “PM10 for all devices” to display the PM10 graph, or the “PM2.5 and PM10…” button to obtain the graph of the simultaneous measurement of PM2.5 and PM10 values in µg/m³.
Fig. 8 shows this graph. In the graph in the same Fig. 8, again with a full scale of 30 µg/m³, PM10 values are found that are higher than those of PM2.5, but not higher than 20 µg/m³, i.e., contained within the range 0-25 µg/m³ relative to the band of low PM10 values in Table 1 (European air quality values). Further information on the installation, configuration and use of SDS011 can be found in the “User Guide” in the “Nova PM2.5 Sensor Software-En-V1.88” folder.

Fig. 8
Conclusions
The project or rather, the application presented in these pages is the starting point for the implementation of combined systems capable of analysing air quality and could be combined with a CO2 percentage meter such as the one published in issue 219 of May 2017. The whole could be integrated with a weather station to obtain global monitoring of indoor/outdoor environmental parameters.
From openstore

Are there MacOS versions of the software available?