
Let’s interface our Energy Meter with Internet to bring measurements to the ThingSpeak platform and see the results in convenient graphs.
A few posts ago, we introduced the MCP39F511 integrated circuit, capable of performing electrical measurements in single-phase electrical systems through the FT1346M board. We have integrated it with the GSM board and its management library to face the system to the external world. Now we want to show you how to combine such hardware with a web platform for IoT device management called “ThingSpeak“. For the occasion, we have written a special sketch that uses the GSM library with integrated AT commands for managing HTTP connections and the management library of the integrated MCP39F511; in these pages, we will explain how to integrate the two libraries and create a page on ThingSpeak to display the acquired data.
Since we will use HTTP to connect to the ThingSpeak platform, we can only use SIMCOM GSM modules: in the sketch we used SIM800C.
THINGSPEAK INTRODUCTION
ThingSpeak is a platform that provides a service for aggregating, visualizing, and analyzing a stream of data from electronic devices identified as IOT (Internet of Things). It is then possible to send data from your device to the platform and view the data received in real-time, possibly sending alerts through the Twitter and Twilio services. In addition, the platform provides MATLAB Analytics, with which you can write and execute MATLAB code to process, analyze and visualize the data received. This allows designers to build IoT systems without setting up server services or writing web software.
The use of ThingSpeak is free of charge for the development of small projects for non-commercial use, e.g. sending less than 3 million messages to the platform per year (an average of 8,200 per day).
When you activate paid licenses you buy Units corresponding to 33 million messages that can be processed and stored in one year or in other words about 90,000 messages per day.
In addition, the Units allow you to create a finite number of Channels.
For our application, we used the Free version, which is more than enough to create a demo.
After this brief introduction to the platform, we can move on to the description of how to create Channels with its related fields.
The first step, for those who are not yet an enabled user, is to register and to do this you must click on “Sign Up” and follow the steps indicated.
Once the registration is done you can proceed to the creation of a new Channel and to do this you must click on the button “New Channel” as shown in Fig. 1, section circled in red. A form will appear to be filled in with several fields, as shown in Fig. 2, the steps to follow are as follows:
1) give a name to the new Channel (Name field); we decided to assign the name EnergyMeter;
2) insert a description of the new Channel to be created (Description field); in this case we have inserted as description “MCP39F511 Energy Meter”;
3) for each Channel you can activate eight different fields, each of these represents a measurement to be saved and processed; we have activated six fields out of eight; in particular, we have the following:
– Field 1 Voltage
– Field 2 Current
– Field 3 Power Factor
– Field 4 Active Power
– Field 5 Reactive Power
– Field 6 Apparent Power
4) if you want, you can insert the geo-localization data, that is Elevation, Latitude and Longitude; with these parameters, a geographic map will be visualized indicating the position of the realized measurement system.
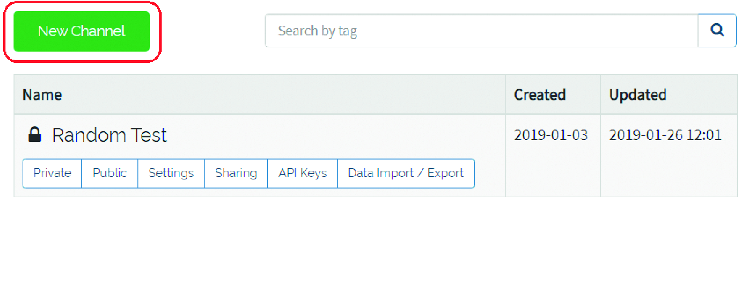
Fig. 1
The Metadata, Tags, Link to External Site and Link to GitHub entries are not used for this application.
Once all these initializations are completed, click on the “Save Channel” button.

Fig. 2
Now, under “My Channels” the newly created channel will appear (Fig. 3): to the left of its name appears a closed padlock, indicating that the display is private; it is possible to configure the Channel as public (the padlock opens) and therefore visible from outside. When you publish the Channel, it can be seen by everyone or only by authorized users.
Clicking on the newly created Channel opens a section where you can:
- modify the configuration parameters of the newly created Channel by clicking on the “Channel Settings” item;
- make the created Channel public/private by clicking on the “Sharing” item;
- configure the display of the data received for each of the “Fields” created in the “Private View” section (the data displayed under this heading will be visible only in the private section);
- configure the display of the data received for each of the “Fields” created in the “Public View” section (the data displayed under this heading will be visible to anyone or to a restricted circle of selected users);
- by clicking on the “API Keys” item you have access to the read/write keys associated with the created Channel.
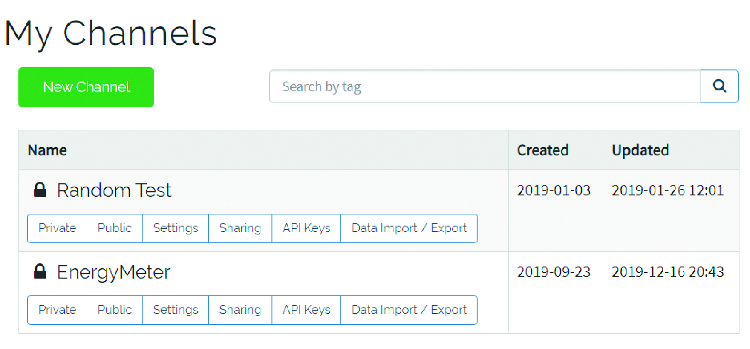
Fig. 3
The write key is obviously different from the read key; the former, associated with the URL address of the connection to ThingSpeak, allows you to send data in string format to the fields previously created. For example:
https://api.thingspeak.com/update?api_key=89QC6FHH0AU5536Z&field1=233
As you can see, in the string there is the writing key assigned to our Channel and at the end of the key there are the fields to which the data must be sent; in the example, there is only “field1” which is assigned the value 233.
Under “Private View” you can configure which data to display among those available and how to display them. Let’s see the commands.
- “Add Visualization allows associating a graph for each configured “Field” among the eight available. If the command is clicked on, a selection window is proposed from which to choose the “Field” whose data is to be visualized (Fig. 4). In this case, only “Field 3” is available, if you click on the chart and then on “Save” the corresponding chart will be created. Fig. 5 shows the newly created graph corresponding to “Field 3”.

Fig. 4

Fig. 5
The chart obviously can be customized and to access the configuration section you must click on the pencil icon at the top right of the chart. In this way the appropriate configuration window is called, as shown in Fig. 6.
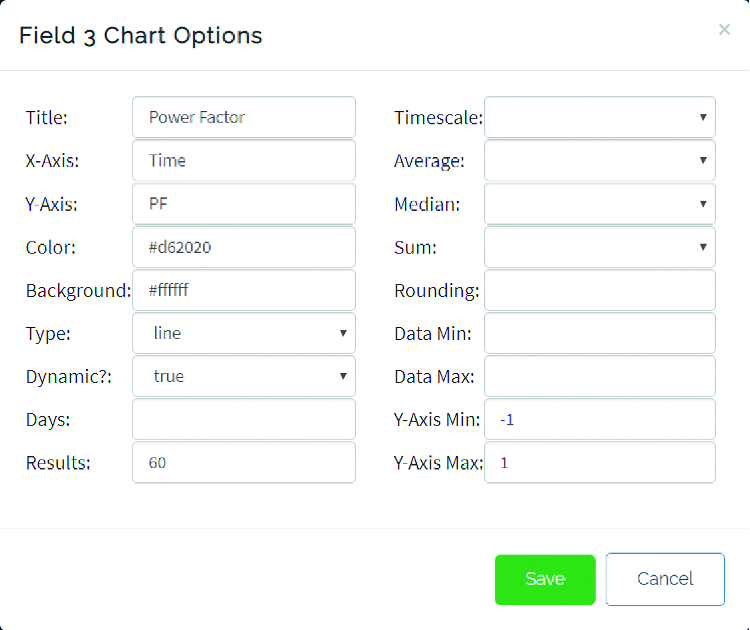
Fig. 6
In this window you can configure:
- Title is used to assign a label to the chart corresponding to “Field 3”: “Power Factor”;
- X-Axis is used to assign a label to the X-axis: “Time”;
- Y-Axis is used to assign a label to the Y-axis: “PF”;
- Color allows you to set the hexadecimal value and the color of the graph;
- Background is used to set hexadecimal value and color of the graph background;
– Type sets the chart type: Line, Bar, Column, Spline and Step;
– Dynamic? is used to set if the chart should be dynamic or not (dynamic means that it is automatically updated every 15 seconds);
– Days sets how many 24 hour periods to wait before including the received value in the feeds;
– Results sets the number of samples to be displayed in the graph;
– Timescale is used to set every how many minutes a data should be displayed among those received (optional);
– Average sets every how many minutes the average value of the received data should be calculated and displayed;
– Median sets every how many minutes the median of the received data should be calculated and displayed;
– Sum is used to set every how many minutes the sum of the received data should be calculated and displayed;
– Data Min is used to set the minimum expected value;
– Data Max is used to set the maximum expected value;
– Y-Axis-Min sets the minimum value to be displayed on the Y-axis;
– Y-Axis Max is used to set the maximum value to be displayed on the Y-axis;
- Add Widgets; allows you to configure other methods of displaying the received data; clicking on this command a selection window appears from which you can choose:
– Gauge is used to set a graphical tachometer-like display (Fig. 7 shows the configuration used for the display of the mains voltage); there are several fields that must be filled in in order to obtain the desired result including:
– Name sets the name to be assigned to the viewer (in this case “Voltage”);
– Field is used to set the associated “Field” from which to take the data to be visualized; here we refer to “Field 1”;
– Min is used to set the minimum value; the expected minimum value is 0 V;
– Max is used to set the maximum value; we expect 350 V as the maximum value;
– Units is used to set the unit of measure (in this case volt “V”);
– Tick Interval is used to set the delta for displaying numbers on the tachometer. In this case, we have set steps of 25 units so that the values are readable without overlapping;
– Update Interval sets how long it takes to refresh the value to be displayed (set to 15 seconds);
– Range is used to setting separate display sections on the tachometer; here the middle section is between 180 V and 250 V (normal value) and the two outer sections are between 0 V and 180 V (mains voltage too low) and between 250 V and 350 V (mains voltage too high) have a different color;
– Numeric Display is used to set a numeric type display (Fig. 8 shows the configuration used for the active power display); here too there are several fields to set:
– Name is used to set the name to be assigned to the viewer (in this case, “Active Power”);
– Field is used to set the associated “Field” from which to take the data to be visualized (here we refer to “Field 4”);
– Update Interval is used to set how often the value to be visualized must be refreshed (15 seconds are set);
– Units of measurement (watts “W”);
– Data Type is used to set whether the value to be visualized is an integer type or with decimals; in the latter case it must be written how many decimals are desired (in this case three);
– Lamp Indicator is used to set an alarm and is like a normally-off LED that lights up if the received data is above or below threshold (depends on settings);
- Export recent data; allows to export the received data in JSON, XML and CSVM so it is possible to export all “Fields” in a single file using the options of line one “EnergyMeter Channel Feed” or each channel individually using the following lines;
- MATLAB Analysis; allows us to create MATLAB code for the analysis of the received data;
- MATLAB Visualization allows you to create MATLAB code to analyze and visualize the received data.

Fig. 7

Fig. 8
Under the item “Public View” we can configure, as already done for the private section, the visualization of the data received from the various “Fields” with the difference that these are visible to the outside. To make the data visible you must call up the “Sharing” section and follow the instructions. The configuration of the public section is identical to the private one, so we will not dwell on it any further.
Fig. 9, Fig. 10 and Fig. 11 show how we configured our “Channel” to display the data received from the MCP39F511 integrated. In the example we wanted to display Voltage, Current and Power Factor measurements both via graph and pointer indicator. Same for Active, Reactive and Apparent power measurements with the difference that for these we have also used the numerical display. The geographic location appears at the bottom of the measures.
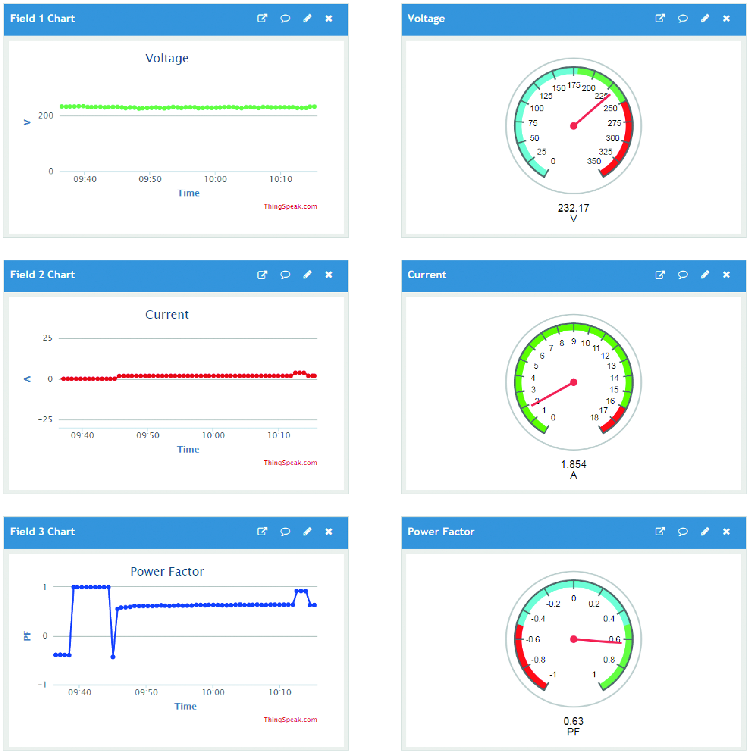
Fig. 9
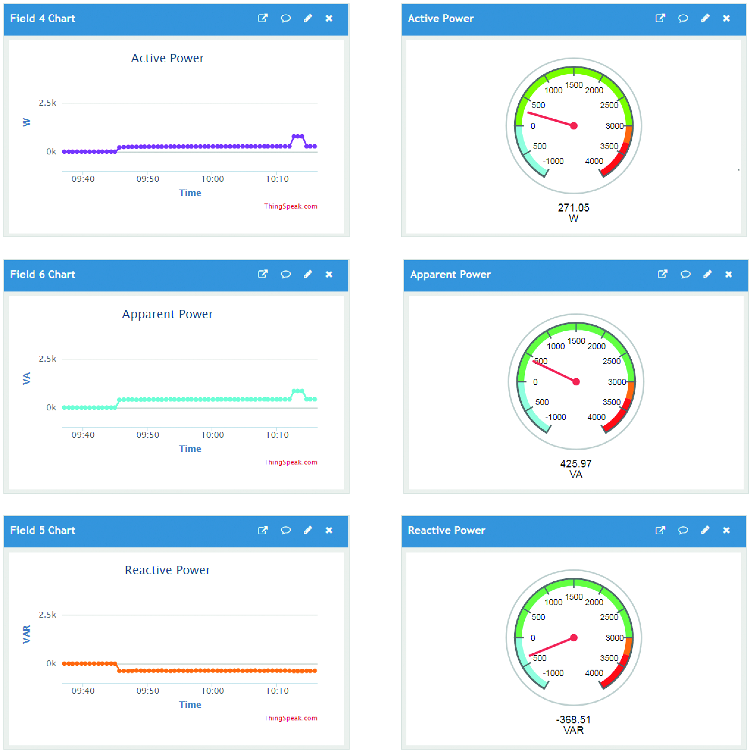
Fig. 10
As noted in Fig. 11 we introduced a graph generated via MATLAB (3-Day Active Power Comparison) that correlates active power acquisitions relative to three days, so that a comparison can be made. The days can also be more or less, depending on the MATLAB code.

Fig. 11
To give an idea, in Listing 1 we report the MATLAB code used to generate the graph: the lines of code that begin with “%” and are colored green identify the comments. Three variables have been declared that identify ID of the channel used (readChannelID), the field you want to graph (myFieldID) and the key to read the data (readAPIKey). The “thingSpeakRead” function takes care of reading the data of the selected channel on the requested day and the “plot” draws the graph. At the bottom we find strings associated with the chart title, X – Y axis labels and a brief legend.
Listing 1
% Channel ID to read data from
readChannelID = 870302;
% Active Power Field ID
myFieldID = 4;
% One day date range
oneDay = [datetime(‘yesterday’) datetime(‘today’)];
% Channel Read API Key
% If your channel is private, then enter the read API key between the ‘’ below:
readAPIKey = ‘LU2P9AT2EOTD79Q8’;
% Read Active Power Data
ActivePower_Day_1 = thingSpeakRead(readChannelID,’Fields’,myFieldID, ...
‘dateRange’, oneDay, ‘ReadKey’,readAPIKey);
ActivePower_Day_2 = thingSpeakRead(readChannelID,’Fields’,myFieldID, ...
‘dateRange’,oneDay-days(1),’ReadKey’,readAPIKey);
ActivePower_Day_3 = thingSpeakRead(readChannelID,’Fields’,myFieldID, ...
‘dateRange’, oneDay-days(2),’ReadKey’,readAPIKey);
% Create array of durations
myTimes1 = minutes(1:length(ActivePower_Day_1));
myTimes2 = minutes(1:length(ActivePower_Day_2));
myTimes3 = minutes(1:length(ActivePower_Day_3));
% Visualize the data
plot(myTimes1,ActivePower_Day_1, myTimes2,ActivePower_Day_2, myTimes3, ActivePower_Day_3);
legend({‘Day1’,’Day2’,’Day3’});
xlabel(‘Minutes’);
ylabel(‘Active Power W’);
title(‘3-Day Active Power Comparison’);
INTEGRATE GSM LIBRARY GSM AND MCP39F511
Having said that, let’s go further: to create the sketch that sends the electrical measurements to the “ThingSpeak” platform, it is necessary first of all to integrate and harmonize the two libraries GSM and MCP39F511 so that they can work together without generating conflicts with the interrupt vectors inherent to the management of TIMER 1, used by both to generate the time base used for the management of all time variables used in the libraries.
In fact if we take the libraries without making any changes and include them in a sketch we will get the following error from the C compiler:
(.text+0x0): multiple definition of `__vector_20′.
Thus, it is necessary to implement unique handling of the interrupt vector of TIMER 1.
Let’s start with the MCP39F511 library and in particular with the files “Isr_MCP39F511.h” and “Isr_MCP39F511.cpp”. In the file “Isr_MCP39F511.h” we create a directive to the compiler named:
#define ENABLE_ISR_TIMER1
which allows to enable/disable the code sections inherent to the TIMER 1 interrupt management. In other words, if the directive is commented out the TIMER 1 interrupt handling code will be ignored, vice versa it will be included in the library.
So when the MCP39F511 library is to be used alone in a sketch it must be uncommented, while if it is to be used together with the GSM library it must be commented. Within the file “Isr_MCP39F511.cpp” the functions affected by this directive are:
void Isr_MCP39F511::EnableLibInterrupt(void)
void Isr_MCP39F511::EnableTimerInterrupt(void)
ISR(TIMER1_OVF_vect)
In addition to the directive just introduced we have to create a new function inside which we have to put the code used in the management of the interrupt vector of TIMER 1:
static volatile void Isr_MCP39F511::Timer1_Interrupt(void)
Inside the function we have the time variable management code needed by the MCP39F511 library that you see in Listing 2. Depending on the selected UART the right time variable will be used. Let’s go now to the GSM module management library and in particular the files “Isr_GSM.h” and “Isr_GSM.cpp”. In the first one we have to introduce a directive to the compiler:
#define ENABLE_EXT_TIMER1
which allows us to enable/disable the code for managing the external TIMER 1 interrupt, that is the part of code created from scratch in the MCP39F511 library. Then we create a function pointer directed to the Flash address where the TIMER 1 interrupt handling function of the MCP39F511 library is stored:
#ifdef ENABLE_EXT_TIMER1

    static void (* volatile __Ext_Timer1_Vector)(void);

#endif
The function pointer is only considered if the directive to the compiler ENABLE_EXT_TIMER1 is uncommented and therefore active. The function pointer is active at the time when the directive to the compiler ENABLE_EXT_TIMER1 is active (i.e. not commented out). That said we must create a function, to be called during the initialization of the sketch, which assigns to the pointer described before the starting address in FLASH where is stored the management function of the interrupt TIMER 1 in the management library of the MCP39F511:
#ifdef ENABLE_EXT_TIMER1

        void Ext_Timer1_Vector(void (*function)(void));

#endif
This is also active if the directive allows it.
The code present in this function is:
#ifdef ENABLE_EXT_TIMER1

    void Isr_GSM::Ext_Timer1_Vector(void (* volatile function)(void))

    {

        __Ext_Timer1_Vector = function;

    }

#endif
and is used to load into the function pointer the Flash address of the function to be called.
Now we have the address to point to and we just have to add inside the management of TIMER 1 interrupt in the GSM library the necessary code to call the desired function:
ISR(TIMER1_OVF_vect) {

    TCNT1 = SLOWBASETIME;

    .........................................

    .........................................

#ifdef ENABLE_EXT_TIMER1

    if (__Ext_Timer1_Vector != NULL) {

        __Ext_Timer1_Vector();

    }

#endif

}
With this we have concluded the modifications to the two libraries. Now inside the sketch, during the initialization phase (void setup()), we need to insert in the right place the following line of code:
Isr.Ext_Timer1_Vector(Isr_39F511.Timer1_Interrupt);
By calling this function we made sure that during the management of TIMER 1 by the GSM library the time variables of the MCP39F511 library are also managed.
The management library of the integrated MCP39F511 in addition to the changes mentioned above has been affected by a further improvement due to the introduction of a series of functions for the calculation of the average value on some electrical measurements. Via the directive to the compiler:
#define ENABLE_AVERAGE_CALC
enable/disable the functions for calculating the average value and relative management arrays. In addition to the above directive, we have introduced another one for defining the dimensions that the arrays needed to calculate the average value must have:
#define AVERAGE_ARRAY_SIZE 4
The allowed values for this directive to the compiler are 4, 8, 16, and 32. The larger the size of the arrays, the more SRAM memory will be needed. Therefore, the size to be used must be chosen carefully depending on the application to be implemented (we will give a concrete example when we talk about the sketch for sending data to the “ThingSpeak” platform). The functions for calculating the average value are as described below.
- uint16_t MCP39F511_RmsVoltageRawAverage(void) ® Calculates the average value for the voltage measurement. The function works on the RAW values read by the MCP39F511 and returns a 16-bit unsigned integer value.
- uint32_t MCP39F511_RmsCurrentRawAverage(void) ® Calculates the average value regarding the current measurement. The function works on the RAW values read by the MCP39F511 and returns a 32-bit unsigned integer value.
- uint16_t MCP39F511_PowerFactorRawAverage(void)® Calculates the average value with respect to the power factor measure. The function works on the RAW values read by the MCP39F511 and returns a 16bit unsigned integer value. The calculated value must then be converted between the allowed values -1 and +1 and needs the auxiliary function uint16_t CalcAveragePowerFactor(void).
- uint16_t MCP39F511_LineFrequencyRawAverage(void) ® Calculates the average value with respect to the line frequency measurement. The function works on the RAW values read by the MCP39F511 and returns a 16-bit unsigned integer value.
- uint32_t MCP39F511_ActivePowerRawAverage(void) ® Calculates the average value with respect to the active power measurement. The function works on the RAW values read by the MCP39F511 and returns a 32-bit unsigned integer value.
- uint32_t MCP39F511_ReactivePowerRawAverage(void) ® Calculates the average value with respect to the reactive power measurement. The function works on the RAW values read by the MCP39F511 and returns a 32-bit unsigned integer value.
- uint32_t MCP39F511_ApparentPowerRawAverage(void) ® Calculates the average value with respect to the apparent power measurement. The function works on the RAW values read by the MCP39F511 and returns a 32-bit unsigned integer value.
Listing 2
//===========================================
// Timeout 8 bit
if (Isr_39F511.ZcdTimeOut > 0) { Isr_39F511.ZcdTimeOut--; }
//===========================================
//===========================================
// Timeout 16 bit
#if defined(HARDWARE_UART1_39F511) || defined(SOFTWARE_UART1_39F511)
if (Isr_39F511.Uart1_TimeOut > 0) { Isr_39F511.Uart1_TimeOut--; } // TimeOut for hardware/software
serial COM 1
#endif
#if defined(HARDWARE_UART2_39F511) || defined(SOFTWARE_UART2_39F511)
if (Isr_39F511.Uart2_TimeOut > 0) { Isr_39F511.Uart2_TimeOut--; } // TimeOut for hardware/software
serial COM 2
#endif
#if defined(HARDWARE_UART3_39F511) || defined(SOFTWARE_UART3_39F511)
if (Isr_39F511.Uart3_TimeOut > 0) { Isr_39F511.Uart3_TimeOut--; } // TimeOut for hardware/software
serial COM 3
#endif
//===========================================
The functions for calculating the mean value are similar, however the array they have to work on changes. Let’s analyze the function for calculating the the grid voltage average value:
uint16_t Cmd_MCP39F511::MCP39F511_RmsVoltageRawAverage(void) {

    uint8_t Index = 0;

    uint32_t AverageTemp = 0;

    do {

        AverageTemp += VoltageRmsRaw_Array[Index++];

    } while (Index < AVERAGE_ARRAY_SIZE);

    return((uint16_t)(AverageTemp / AVERAGE_ARRAY_SIZE));

 }
As you can see, apart from the local variables, we have the do-while construct that takes care of averaging over the values contained in the corresponding array.
The larger the size of the array, the longer it will take to calculate the average value. The function, in this case, returns a 16-bit unsigned integer value.
The following functions are used to load the values into the respective arrays:
- void MCP39F511_UpdateRmsVoltageRawArray(void) ® Loads the last read value of the RMS voltage into the “VoltageRmsRaw_Array” array;
- void MCP39F511_UpdateLineFrequencyRawArray(void) ® Loads the last read value of the network frequency into the “LineFrequencyRaw_Array” array;
- void MCP39F511_UpdatePowerFactorRawArray(void) ® Loads the last read value of the power factor into the “PowerFactorRaw_Array” array;
- void MCP39F511_UpdateRmsCurrentRawArray(void) ® Loads the last read value of the RMS current into the “CurrentRmsRaw_Array” array;
- void MCP39F511_UpdateActivePowerRawArray(void) ® Loads the last read value of the active power into the “ActivePowerRaw_Array” array;
- void MCP39F511_UpdateReactivePowerRawArray(void) ® Loads the last read value of the reactive power into the “ReactivePowerRaw_Array” array;
- void MCP39F511_UpdateApparentPowerRawArray(void) ® Loads the last read value of the apparent power into the “ApparentPowerRaw_Array” array.
The exact sequence of use of the exposed functions, assuming we are working on the RMS voltage, is:
Cmd_39F511.MCP39F511_ReadRmsVoltageRaw();
Cmd_39F511.MCP39F511_UpdateRmsVoltageRawArray();
Cmd_39F511.MCP39F511_RmsVoltageRawAverage();
GPRS, TCPIP, and HTTP LIBRARY FUNCTIONS
In the GSM library, which we have discussed in previous articles, we have added the functions necessary to manage data connections. Three new files named respectively “GprsCmd_GSM.cpp”, “TcpIpCmd_GSM.cpp”, “HttpCmd_GSM.cpp” and related .h files have been created. The GSM SimCom modules are fully supported, the Quectel M95 is partially supported, and the Fibocom G510 is not supported.
When it is necessary to use AT commands to manage data connections, a preliminary GSM module initialization section similar to the one already used and widely explained for GSM connections (SMS and Voice) must be performed. So the latest available revision of our library can run:
- Basic initialization of the GSM module for SMS and voice management;
- Initialization to GPRS (General Packet Radio Service);
- Data connection initialization for applications that use the HTTP service with GET/POST.
So the additional initialization sequence for data connections is as follows:
- AT+CGATT? starts with a command that checks if the device is connected or not to the GPRS service and, according to the result obtained, it will execute or not the next command;
- AT+CGATT=1 hooks the GSM module to the GPRS;
- AT+CIPMUX=0 enables a Single IP Connection;
- AT+CGEREP=1 enables the GSM to send, via serial interface, the unsolicited result codes concerning the connection to the GPRS service;
- AT+CSTT=”OWN OPERATOR ” ® sets the APN (Access Point Name) and, if necessary, also sends User Name and Password;
- AT+CIICR activates the data connection to the GPRS service;
- AT+CIFSR command to display the local IP address assigned by the GPRS service;
- AT+CGDCONT=1, “IP”, “OWN OPERATOR” used to define the PDP context (“Packet Data Protocol”); the PDP context used is “IP”;
- AT+CGATC=1,1 activates the PDP context;
- AT+CGPADDR=1 command used to display the IP address assigned to the PDP context, which is different from the IP address assigned by the GPRS service;
- AT+CIPHEAD=1 used to configure the GSM module to return the IP address of the sender at the head of the received data packet;
- AT++CIPSRIP=1 sets the GSM module to return, via “unsolicited result code”, the remote IP address and port when a data packet is received;
- AT+SAPBR=3,1, “CONTYPE”, “GPRS ” configures the data connection type for applications with IP;
- AT+SAPBR=3,1, “APN”, “OWN OPERATOR ” used to configure own operator APN for IP-based applications;
- AT+SAPBR=1,1 activates the carrier for IP-based applications;
- AT+SAPBR=2,1 request assigned IP address (the returned IP is equal to the one assigned by the GPRS service).
To enable initialization of the GPRS and HTTP section, the following flags must be set to one:
Gprs.GprsFlag.Bit.EnableGprsFunctions = 1; // Enable GPRS functions
Http.HttpFlag.Bit.EnableHttpFunctions = 1; // Enable HTTP functions
Instead, the handling code in the sketch to ensure the correct initialization sequence is:
Gsm.ExecuteUartState();

if (Gsm.GsmFlag.Bit.GsmInitInProgress == 1) {

    Gsm.InitGsmSendCmd();

    Gsm.InitGsmWaitAnswer();

} else if (Gsm.GsmFlag.Bit.GprsInitInProgress == 1) {

    Gprs.InitGprsSendCmd();

    Gprs.InitGprsWaitAnswer();

} else if (Gsm.GsmFlag.Bit.HttpInitInProgress == 1) {

    Http.InitHttpSendCmd();

    Http.InitHttpWaitAnswer();

} else {

Gsm.UartContinuouslyRead();

Gsm.ProcessUnsolicitedCode();

Gsm.GsmAnswerStateProcess();

…............

…............

}
As you can see, it contains three independent initialization sections: the first one is the classic one for voice and SMS applications, the second one takes care of the initialization of the GPRS service, and finally the initialization for HTTP applications (used to send data to ThingSpeak).
Below is the complete sequence of AT commands sent to initialize the data connection:
AT+CGATT?<CR><LF>
<CR><LF>
+CGATT: 1<CR><LF>
<CR><LF>
OK<CR><LF>
AT+CIPMUX=0<CR><LF>
<CR><LF>
OK<CR><LF>
AT+CGEREP=1<CR><LF>
<CR><LF>
OK<CR><LF>
AT+CSTT=”iliad”<CR><LF>
<CR><LF>
OK<CR><LF>
AT+CIICR<CR><LF>
<CR><LF>
OK<CR><LF>
AT+CIFSR<CR><LF>
<CR><LF>
10.145.242.241<CR><LF>
AT+CGDCONT=1,”IP”,”iliad”<CR><LF>
<CR><LF>
OK<CR><LF>
AT+CGACT=1,1<CR><LF>
<CR><LF>
+CGEV: ME PDN ACT 1<CR><LF>
<CR><LF>
OK<CR><LF>
AT+CGPADDR=1<CR><LF>
<CR><LF>
+CGPADDR: 1,”10.65.240.242”<CR><LF>
<CR><LF>
OK<CR><LF>
AT+CIPHEAD=1<CR><LF>
<CR><LF>
OK<CR><LF>
AT+CIPSRIP=1<CR><LF>
<CR><LF>
OK<CR><LF>
AT+SAPBR=3,1,”CONTYPE”,”GPRS”<CR><LF>
<CR><LF>
OK<CR><LF>
AT+SAPBR=3,1,”APN”,”iliad”<CR><LF>
<CR><LF>
OK<CR><LF>
AT+SAPBR=1,1<CR><LF>
<CR><LF>
OK<CR><LF>
AT+SAPBR=2,1<CR><LF>
<CR><LF>
+SAPBR: 1,1,”10.145.242.241”<CR><LF>
<CR><LF>
OK<CR><LF>
In addition to the AT commands just described, the library provides a series of other commands for managing the data connection via HTTP service (used in our example sketch).
- AT+HTTPINIT ® used for initializing the HTTP service, must be executed first.
- AT+HTTPSTATUS? ® reads the status of the HTTP service; it receives as response four parameters: <mode>, <status>, <finish> and <remain>. The first parameter indicates whether a “GET”, “POST,” or “HEAD” command is in progress. The second parameter indicates the status of the service, i.e., “0” waiting, “1” receiving, or “2” transmitting data. The third parameter indicates how much data has been transmitted, and the last parameter indicates how much data still needs to be sent or transmitted.
- AT+HTTPPARA ® used to set the parameters of the HTTP service. The command is divided into two distinct parts, the first part sets the parameter for the HTTP service (AT+HTTPPARA=”CID”,1), while the second part sets the connection URL with the data to be sent to ThingSpeak” (AT+HTTPPARA=”URL”, “http://api.thingspeak.com/update.json?………”).
- AT+HTTPACTION=0 ® used to set whether a “GET” (0), “POST” (1), “HEAD” (2) or “DELETE” (3) should be performed. (2) or a “DELETE” (3).
- AT+HTTPTERM ® terminates the HTTP service and must be executed as the last command.
The following is the sequence of the AT commands used to send data to the ThingSpeak platform via the HTTP service: at the top and at the bottom, we have the command for initializing the HTTP service and the command for terminating the service, respectively. After that, the HTTPSTATUS command is used to verify that the service is not busy, and if free, the data is sent to the platform using the HTTPPARA command (two commands executed in sequence). The HTTPACTION command follows this for performing the “GET” command to the selected URL (Listing 3).
One last consideration regarding data connection management: there are constants strings that must be saved in EEPROM as already done for PIN codes, PUKs, and others. So there are directives to the compiler where these constants are defined and the maximum space they can occupy in EEPROM. However, the writing in EEPROM of these string constants can only be done through a special sketch that we have already discussed on other occasions. The string constants that must be saved in EEPROM are:
- APN phone operator;
- Username and Password for APN (they are not always used but have been defined anyway in case of need);
- PDP context;
- remote server IP address for TCP/IP data connection; a maximum of three IP addresses are allowed if multiple connections are used (AT+CIPMUX=1);
- Remote server domain for TCP/IP data connection (a maximum of three domains are allowed in case of multiple connections);
- connection port to the remote server (up to three ports are allowed in case of multiple connections);
- URL for the HTTP service;
- IP Proxy;
- Proxy Port.
The starting addresses in EEPROM for each of these strings are retrieved by code during the sketch initialization phase and saved in the appropriate data structures so that they are always accessible.
Listing 3
AT+HTTPINIT<CR><LF>
<CR><LF>
OK<CR><LF>
AT+HTTPSTATUS?<CR><LF>
<CR><LF>
+HTTPSTATUS: GET,0,0,0<CR><LF>
<CR><LF>
OK<CR><LF>
AT+HTTPPARA=”CID”,1<CR><LF>
<CR><LF>
OK<CR><LF>
AT+HTTPPARA=”URL”,”http://api.thingspeak.com/update.json? api_key=89QC6FHH0AU9636Z&field1=230.44&field2=
00.000&field3=0.998&field4=-00000.00&field5=-00000.00&field6=00000.00”<CR><LF>
<CR><LF>
OK<CR><LF>
AT+HTTPACTION=0<CR><LF>
<CR><LF>
OK<CR><LF>
<CR><LF>
+HTTPACTION: 0,200,278<CR><LF>
AT+HTTPSTATUS?<CR><LF>
<CR><LF>
+HTTPSTATUS: GET,0,0,0<CR><LF>
<CR><LF>
OK<CR><LF>
AT+HTTPTERM<CR><LF>
<CR><LF>
OK<CR><LF>
THE SKETCH
Before starting the description of the Arduino firmware, let’s spend a few words on programming the EEPROM memory with all the string constants. The definition of the Arduino board used is contained in the GSM library, particularly in the “Io_GSM.h” file. In our case, we are using Arduino Mega 2560, and therefore, the directive is active:
#define ARDUINO_MEGA2560_REV3
while the other is obviously commented. Always in the file “Io_GSM.h” have been enabled the directives for the management of state machines for AT commands for GPRS, TCP/IP, and HTTP.
#define ENABLE_ANSWER_GPRS_AT_CMD_STATE
#define ENABLE_ANSWER_TCP_IP_AT_CMD_STATE
#define ENABLE_ANSWER_HTTP_AT_CMD_STATE
and related states:
#define ANSWER_GPRS_AT_CMD_STATE 5
#define ANSWER_TCP_IP_AT_CMD_STATE 6
#define ANSWER_HTTP_AT_CMD_STATE 7
In the sketch of writing to EEPROM must be defined the string constants necessary for the data connection, in particular, for our application, are strictly necessary only the following:
const char FLASH_APN[] PROGMEM = “\”iliad\””
const char FLASH_HTTP_URL[] PROGMEM = “\”http://api.thingspeak.com/update.json?api_key=89QC6FHH0AU9636Z\””
The first one indicates the APN provided by your phone operator for the data connection, so you have to insert the APN provided by your operator, while the second one is the URL needed for the data connection to the “ThingSpeak” platform concerning your channel. If used, you will also have to configure the PIN and PUK code string. Everything else can be left unchanged.
Having said that, you’ll have to program the Arduino Mega with the code in the sketch.
Let’s analyze our sketch, which is divided into five separate files.
- GSM_EnergyMeter_Thingspeak.ino Main file with all variable declarations, declaration of I/O potentially usable by the sketch, directives to the compiler of the string constants used by the serial monitor, definition of the state machines used as well as the two functions “void setup()” and “void loop().”
- DigitalInput.ino contains the management of the digital input I/O. Currently, the digital inputs of the two buttons P1 and P2 of the GSM_EnergyMete R.1.0 board are not used in this version of the sketch.
- DigitalOutput.ino contains the management of the digital output I/O. The output I/O of the GSM_EnergyMete R.1.0 board are the buzzer, the two relays, and the four LEDs.
We need only LEDs 1 and 4. - Measures.ino contains the code needed to manage the state machine that reads the data of the electrical measurements made by the MCP39F511 and the relative code for printing on the serial monitor.
- Timersint.ino ® contains the management of the interrupt vector for TIMER 5. Time base 2 ms.
Let’s analyze first the file GSM_EnergyMeter_Thingspeak.ino where at the top, we find the directive to the compiler that indicates how often we want to send data about electrical measurements to the platform “ThingSpeak.” Directive:
#define TIMEOUT_THINGSPEAK_SEND_DATA
accepts as values 20, 30, 0 60, indicating that data should be sent every 20, 30, and 60 seconds, respectively. The directives should accompany this directive to the compiler in the MCP39F511 management library, namely:
#define ENABLE_AVERAGE_CALC
#define AVERAGE_ARRAY_SIZE 4
The first enables the calculation of the average value over the electrical measurements taken, while the second defines the size of the array to be used to average the values. Allowed values are 4, 8, 16, or 32.
Since the reading of electrical measurements occurs every two seconds, it is recommended to have a buffer of length 8 for sending data every 20 seconds, a buffer of length 16 for sending data every 30 seconds, and a buffer of 32 if you send data every 60 seconds. It is not mandatory to calculate the average value to be sent to the platform; if you want to send the instantaneous value without averaging, it is necessary to comment on the above directive. The average of the read values will be automatically disabled. Fig. 12 shows a hypothetical measurement scenario where the blue trace is the time trend of the mains voltage read every 2 seconds (a sample every two seconds). The red signal is the average value calculated with a buffer of length 8. In purple, we have the time when data are sent to ThingSpeak (every 20 s). There are two possible scenarios: the first one sees the calculation of the average value disabled, then every 20 seconds, the last instantaneous value measured will be sent to the platform. Doing so will cause you to lose all samples between one submission and the next.
The second scenario involves calculating the average value, so every 20 seconds, the average value calculated on eight samples is sent (one sample every two seconds).
There is no loss of information because intermediate samples between one submission and the next are always considered.

Fig. 12
The concept becomes more apparent by looking at Fig. 13, where data is sent every 30 seconds and every 60 seconds, respectively. In the top graph, the mean value is calculated using a buffer of length 16, the signal in yellow; as shown in Fig. 12, the signal is slower in tracking the original sampled signal due to the longer buffer. Same for the bottom graph, where the buffer is 32 long; in this case, it is more evident that if averaging was disabled, sending the instantaneous value read every 60 seconds would be poor in information since all the variety sampled between one sending and the next would be lost.

Fig. 13
Buffer helps solve this problem by keeping track of past samples.
The downside is that the longer the buffer, the more SRAM is required to hold the samples needed to perform the averaging; it also requires a longer computation time. Note that sending a sample every 20 seconds means that 1,576,800 samples per year will be sent to the platform, just over half of those available with the free version. If you instead send samples every 30 seconds, it will be 1,051,200 samples in a year. Finally, at 60-second intervals, the platform will receive 525,600 samples per year.
Let’s proceed with the sketch analysis; at the top of the file, we find the string constants used both during the printing on the serial monitor of the electrical measures and the strings that define the field “field” for the values to be sent to the platform.
Let’s analyze the function “void setup()” that initializes the sketch, which must deal with:
- retrieve the EEPROM addresses where all GSM library management constants, including data connections, are stored;
- configure the input and output I/O of the GSM shield;
- configure the input and output I/O of the Energy Meter shield;
- configure ISR Timer 1 library Energy Meter management from GSM library;
- configure the UART for the serial monitor;
- configure the UART for communication with the GSM module;
- enable the GSM library interrupt;
- enable the Energy Meter library interrupt;
- start the initialization of the GSM module;
- print the sketch revision on the serial monitor.
At this point the initialization is complete and we can move on to the “void loop()” function where we find:
ProcessStateMachineGsm();
ProcessHttpCmd();
The first function contains the code needed to manage the GSM module, the three initialization steps, and the state machine management functions to send the AT commands required by the HTTP service toward the ThingSpeak platform. The state machine for reading electrical measurements is also managed when fully operational, which starts the reading sequence every two seconds. In this case, the relative printing of the read values on the serial monitor is once every five seconds.
During the reading of the electrical measurements, if the function is enabled, the respective arrays are loaded to calculate the average value. When necessary, the corresponding function is then called that performs the average value calculation for each of the functions for which it is provided. For example, the functions needed to calculate the average value are called before printing the read average value on the serial monitor or before sending the data to ThingSpeak. The values contained in the arrays are of type RAW, so they must be converted to the correct value to display depending on how many decimal places are provided. For example, the following is used to print the average value of the RMS voltage:
Serial.println((float)(Cmd_39F511.MCP39F511_RmsVoltageRawAverage())/(pow(10, VOLTAGE_DEC)));
The constant VOLTAGE_DEC is equal to two because the RMS voltage measurements have only two decimal places; as you can see, the average value calculation was done during the printing on the Serial Monitor.
Let’s now talk about the state machine for handling AT commands for sending data to the platform via the HTTP service. The function provides a series of steps managed through a “switch-case” construct. Each AT command is sent at a rate of one second apart. So the function first makes sure that there are no pending processes by checking the status of some flags. If the time variable “Isr.TimeOutWait” is zero, it proceeds with sending the AT command corresponding to the current status.
The sequence involves initializing the HTTP service (step 1) followed by a service status request (step 2). If the service is free, you start sending data using the HTTPPARA command divided into two steps (steps 3 and 4). In step 4, you send the data to the selected URL (saved in EEPROM) and queue the data to be sent to the platform. The next step (step 5), through the HTTPACTION command, requires a GET to the selected URL. In the next step (step 6), the command is sent again to check the status of the service. If this is the case, we verify that the ACTION command is successful, and only then do we start to close the HTTP service with the termination command. In Listing 4, you will find the code just described.
The composition of the command to send data to the selected URL uses the “SetDataToHttpThingSpeak()” function to load a special array of the GSM library “Http.UrlParameters”.
Setting the “Http.HttpFlag.Bit.AddHttpParameters” flag to “1” tells the library that it must queue the string in the “Http.UrlParameters” array to the AT command.
While sending data to the platform, LED 6 (yellow) on the GSM shield is lit, while LED 9 (green) flashes to indicate that the code is running smoothly.
On the other hand, on the EnergyMeter shield, LED 1 (red) is lit during the reading phase of the electrical measurements and LED 4 (green) during the printing phase on the serial monitor of the same.
Listing 4
void ProcessHttpCmd(void) {
if ((Gsm.GsmFlag.Bit.GsmSendCmdInProgress == 0) && (Gsm.GsmFlag.Bit.GsmInitInProgress == 0) &&
(Gsm.GsmFlag.Bit.GprsInitInProgress == 0) && (Gsm.GsmFlag.Bit.HttpInitInProgress == 0)) {
if (Isr.TimeOutWait == 0) {
Isr.TimeOutWait = T_1SEC;
switch (LocalStateSendCmd)
{
case CMD_AT_HTTP_INIT:
Http.SetCmd_AT_HTTP_INIT();
LocalStateSendCmd = CMD_ATQ_HTTP_STATUS_1;
break;
case CMD_ATQ_HTTP_STATUS_1:
Http.SetCmd_AT_HTTP_STATUS();
LocalStateSendCmd = CMD_AT_HTTP_PARA_STEP_1;
break;
case CMD_AT_HTTP_PARA_STEP_1:
if (Http.HttpFlag.Bit.HttpStatus > 0) {
Http.SetCmd_AT_HTTP_STATUS();
break;
}
Io.LedOn(PIN_LED6);
Http.SetCmd_AT_HTTP_PARA(HTTP_PARAM_CID_CODE);
LocalStateSendCmd = CMD_AT_HTTP_PARA_STEP_2;
break;
case CMD_AT_HTTP_PARA_STEP_2:
Http.HttpFlag.Bit.AddHttpParameters = 1;
SetDataToHttpThingSpeak();
Http.SetCmd_AT_HTTP_PARA(HTTP_PARAM_URL_CODE);
LocalStateSendCmd = CMD_AT_HTTP_ACTION;
break;
case CMD_AT_HTTP_ACTION:
Http.SetCmd_AT_HTTP_ACTION(HTTP_ACTION_METHOD_GET);
LocalStateSendCmd = CMD_ATQ_HTTP_STATUS_2;
break;
case CMD_ATQ_HTTP_STATUS_2:
TimeOutHttpAction = T_5SEC;
Http.SetCmd_AT_HTTP_STATUS();
LocalStateSendCmd = CMD_AT_HTTP_TERM;
break;
case CMD_AT_HTTP_TERM:
if (Http.HttpFlag.Bit.HttpStatus > 0) {
Http.SetCmd_AT_HTTP_STATUS();
break;
}
if (Http.HttpFlag.Bit.HttpStatusCode != 200) {
if (TimeOutHttpAction > 0) {
break;
}
}
Http.SetCmd_AT_HTTP_TERM();
LocalStateSendCmd = CMD_AT_HTTP_INIT;
#if TIMEOUT_THINGSPEAK_SEND_DATA == 20
Isr.TimeOutWait = T_12SEC;
#elif TIMEOUT_THINGSPEAK_SEND_DATA == 30
Isr.TimeOutWait = T_22SEC;
#elif TIMEOUT_THINGSPEAK_SEND_DATA == 60
Isr.TimeOutWait = T_52SEC;
#else
Isr.TimeOutWait = T_22SEC;
#endif
Io.LedOff(PIN_LED6);
break;
case CMD_AT_NOTHING:
Io.LedOff(PIN_LED6);
break;
default:
break;
}
}
}
}
CURIOSITIES
Some smartphones APPs allow you to view the graphs on ThingSpeak for the selected ID and its reading API key on your cell phone. We have tried, on the Android platform, “ThingView Free” (there is also a paid version that is richer in features called “ThingView Full,” which costs about 2 €) and, once installed, allows us to configure the channel to view among those available on your account.
Fig. 14 shows the configuration section where you have to enter the channel ID and uncheck or leave the checkmark on the “Public” label (if the channel is private, uncheck it).
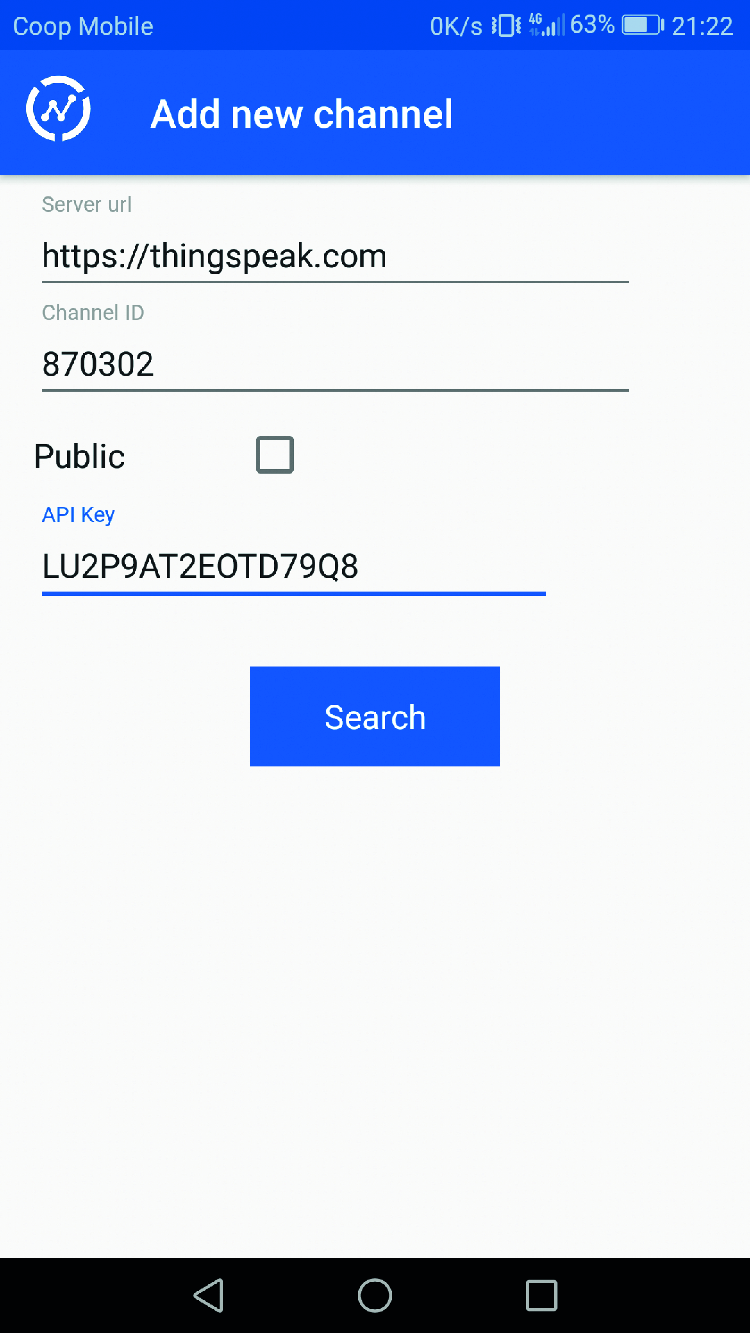
Fig. 14
Fig. 15 shows our channel with the corresponding electrical measurements: click on “Done” to confirm the data and get the reference to the channel with the measures (Fig. 16); selecting the channel will display only the graphs set in the channel as shown in Fig. 17 and Fig. 18. With the paid version, you get additional and advanced features for data visualization, allowing for more in-depth analysis (Fig. 19).

Fig. 15
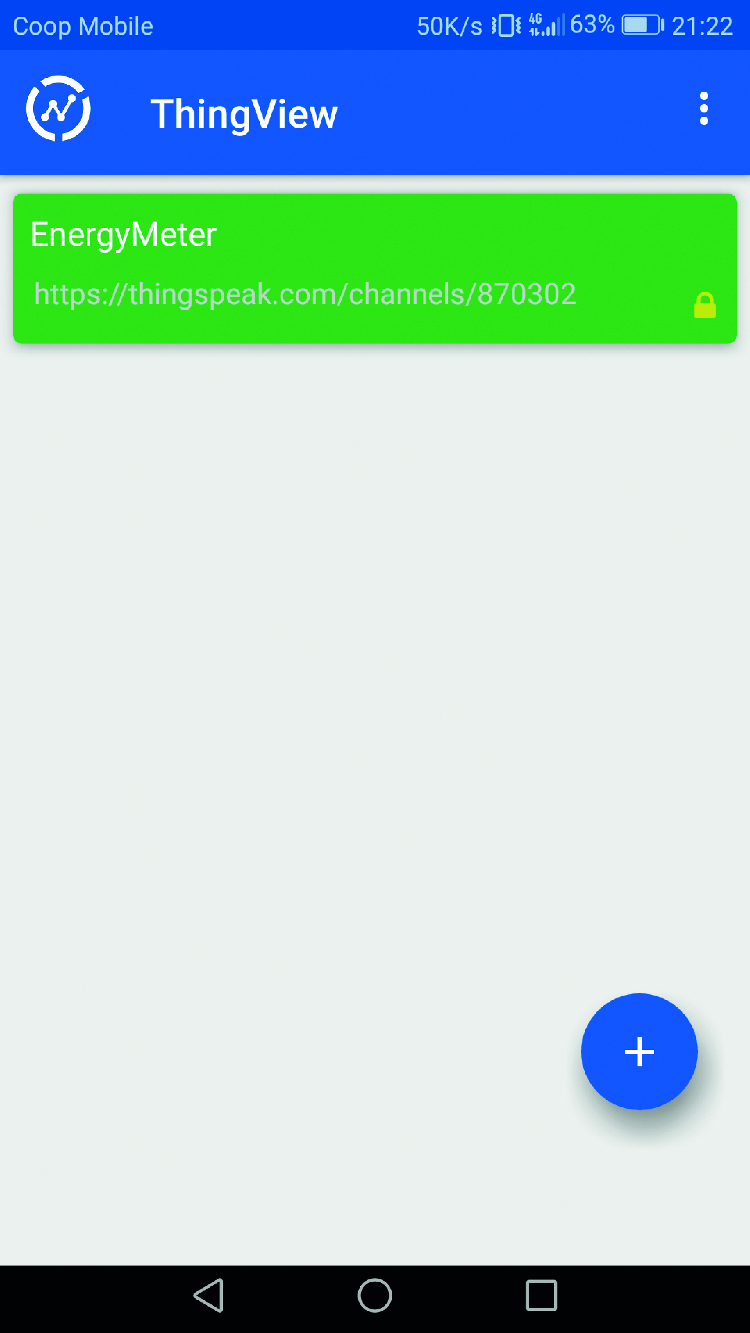
Fig. 16
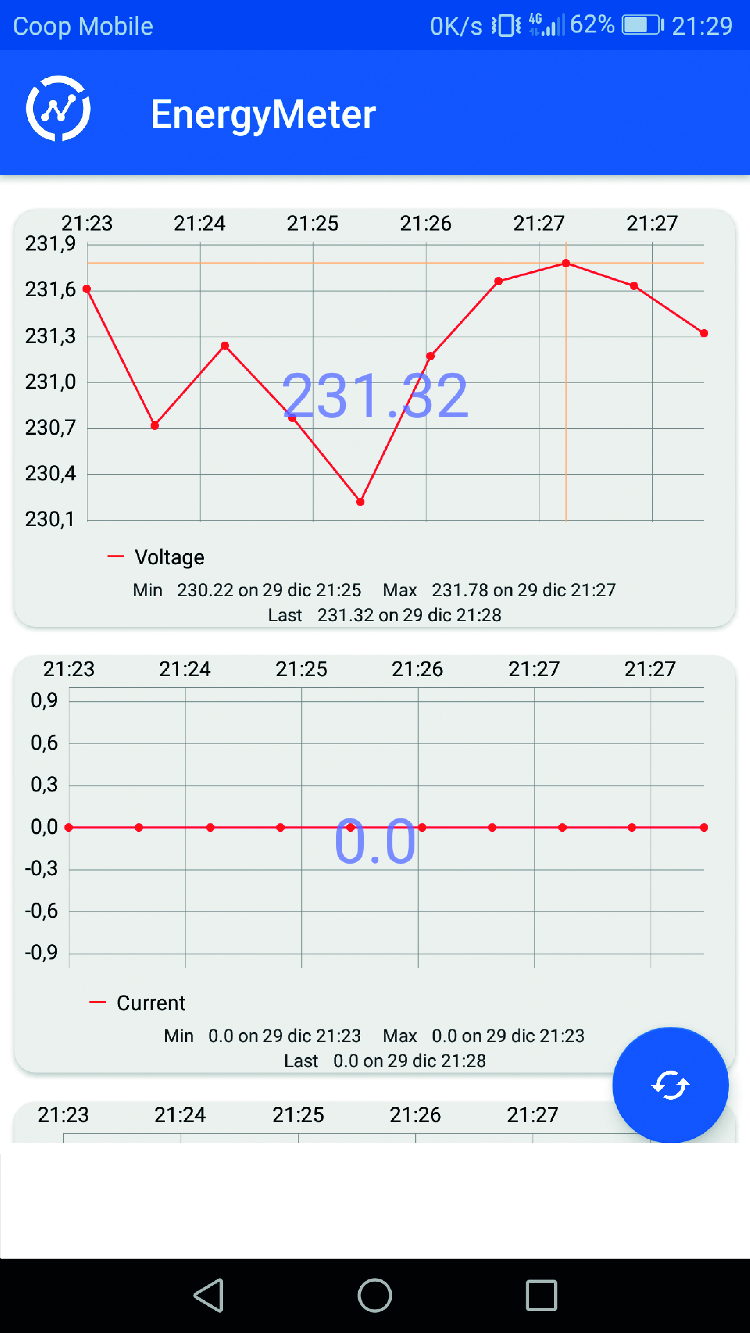
Fig. 17
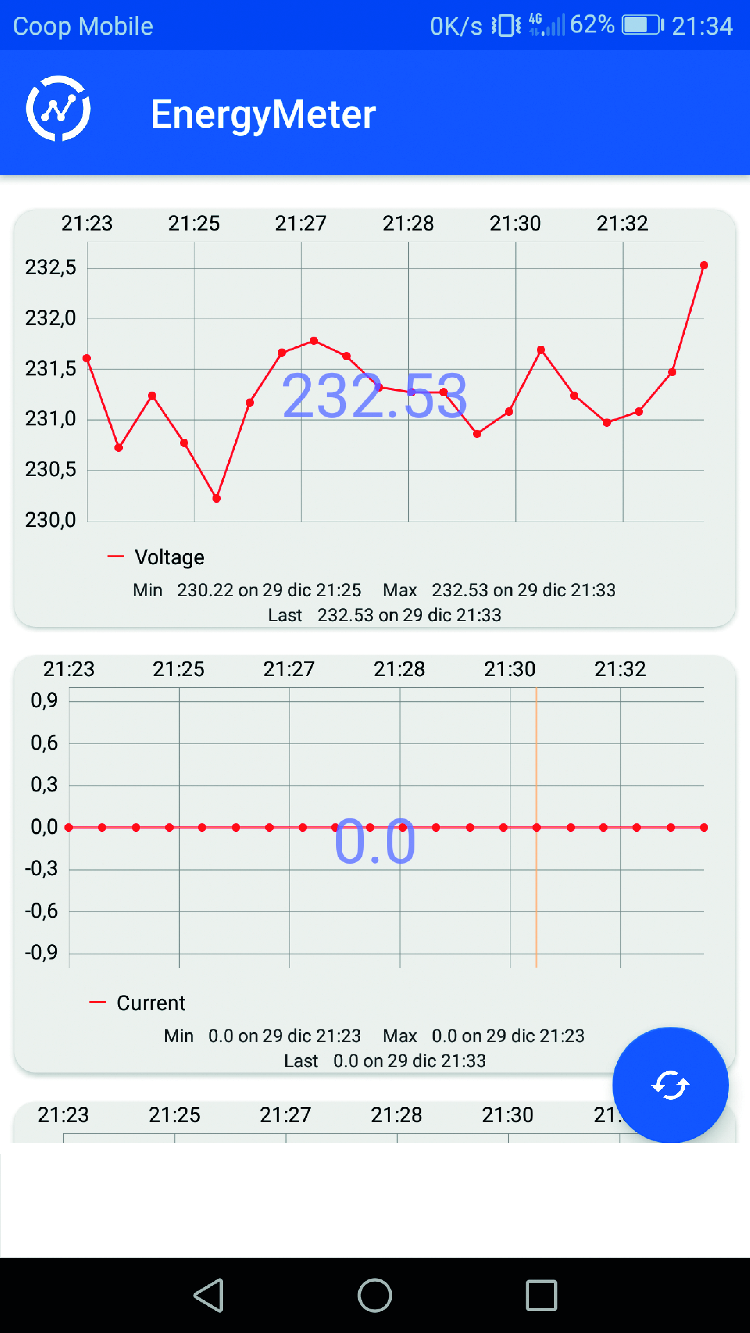
Fig. 18

Fig. 19
CONCLUSIONS
We can consider concluded both the discussion of the sketch for sending data to the ThingSpeak platform and the changes made to the libraries for managing GSM modules and the integrated MCP39F511.
FROM OPENSTORE
VOLTAGE MEASUREMENT TRANSFORMER
CURRENT MEASUREMENT TRANSFORMER
