- makeITcircular 2024 content launched – Part of Maker Faire Rome 2024Posted 2 weeks ago
- Application For Maker Faire Rome 2024: Deadline June 20thPosted 2 months ago
- Building a 3D Digital Clock with ArduinoPosted 7 months ago
- Creating a controller for Minecraft with realistic body movements using ArduinoPosted 7 months ago
- Snowflake with ArduinoPosted 8 months ago
- Holographic Christmas TreePosted 8 months ago
- Segstick: Build Your Own Self-Balancing Vehicle in Just 2 Days with ArduinoPosted 8 months ago
- ZSWatch: An Open-Source Smartwatch Project Based on the Zephyr Operating SystemPosted 9 months ago
- What is IoT and which devices to usePosted 9 months ago
- Maker Faire Rome Unveils Thrilling “Padel Smash Future” Pavilion for Sports EnthusiastsPosted 10 months ago
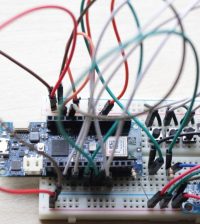
Visualize your bitcoin gain and loss with arduino & python

To get real-time bitcoin data, I used an api provided by OKex, which is a large crypto currency exchange. Then I used python to calculate my gain and loss based on the streaming data. I set my target gain and loss to 5% everyday, which means more lights are on, my investment is closer to my target gain or loss. If all leds are turned on or off, the strip will statr to blink. So I can make decision about whether to keep holding or sell my bitcoins.


