We create the instrument that the reports have brought in vogue, but that for years has been used in hospitals and in sports medicine to verify the degree of oxygenation of the blood.
The Coronavirus epidemic that we have experienced, and in a certain sense are still experiencing, has put on everyone’s lips terms such as interstitial pneumonia, pulmonary ventilator, intensive care and saturation meter; things that the press has brought into our homes on a daily basis and that fortunately have always been foreign to those who were not insiders or directly involved patients. It has made us aware of aspects that we probably would never have wanted to know, but like any event in life, COVID-19 can be an opportunity to learn and treasure what we have seen and heard in spite of ourselves. Given the topicality of the matter, we thought we would give a face to one of the clinical devices now in vogue, for the role it plays in monitoring the health status of a patient caught by what seems to be one of the main complications of COVID-19, namely respiratory failure: we mean the saturation meter, which is a medical device capable of detecting the level of oxygenation of the blood and therefore the quality of gaseous exchanges and the efficiency of the respiratory system; the electronic saturation meter works by analysing the transparency of the peripheral vessels of the fingertip, which is invested by a beam of light whose reflection or crossing of the finger is detected. The quality of the radiation that reaches the light detector diode gives an indication of the oxygen content, since the darker the blood, the less oxygenated it is, and vice versa, the lighter the blood (bright red), the higher the percentage of oxygen.
Saturation is expressed as a percentage and the maximum is obviously 100%, while values above 92-93% are good. Of course, the percentage that can be detected depends not only on the state of the lungs, but also on the quality of the inhaled air and the presence of factors that may reduce the availability of oxygen in the air.
The project
So let’s see what it is, analysing the device that we are presenting: to create the saturation meter that we propose, which is obviously electronic, we used a blood oxygenation meter and heart rate detector with light reflection on a breakout board, based on the integrated MAX30100; to be exact we are talking about a sensor for “pulse oximetry” that is able to measure, in a non-invasive and combined way, the amount of haemoglobin bound to oxygen in the blood and also the frequency of heart beats through the variation of the calibre of blood vessels.
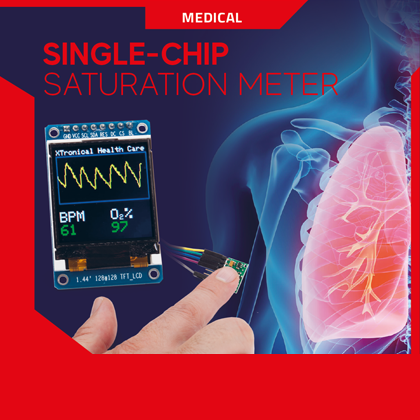
The sensor communicates the data via I²C-Bus on the saturation and also those on the pulse of the blood (which will enable the drawing of a graph type electrocardiogram, as well as to infer the frequency of the heartbeat) so we used an Arduino board to acquire this information, process them and transform them into a format suitable to control a small IPS display on which we will see at the top an ECG (electrocardiogram) even if not as complete as that obtainable from an electrocardiograph, and at the bottom the pulse rate (BPM, or beats per minute or, if you prefer the Anglo-Saxon terms, beats per minute…) on the left and the percentage of oxygen saturation on the right.
Oxygen and pulse detection
The Maxim IC sensor already mounted on the breakout board is the one you see in Fig. 1.
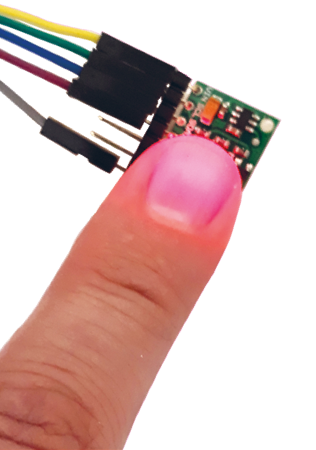
Unlike most of the sensors for saturation to be applied to the fingertip (which project a beam of light on the skin and detect the illuminance from the surface of the nail) this transducer of Maxim IC works by emitting to the top of the chip the light produced by two LEDs, one red (red light at a wavelength of 660 nm) and the other infrared (infrared emitter at 880 nm): by placing your finger on it, a part of the light penetrated into it is reflected and the amount of reflected light captured by a photodiode on the same surface from which the combined light is emitted allows to determine, based on transparency and changes in transparency over time both the trend of blood flow and the percentage of oxygen in it (the percentage of haemoglobin saturated by oxygen).

Fig. 1
Specifically, the electrical signal produced by the photodiode is sent to a low-noise amplifier and signal conditioner stage, then what results enters a block of analogue signal processing that allows the extraction of data on oximetry and heart rate. The latter is obtained by analysing changes in blood flow patterns through the dilation and constriction of peripheral vessels caused by the pulsation and release of the heart’s ventricles, which cause blood pressure to rise and fall.
The Maxim component also has a proximity detection feature to save energy and reduce visible light output when the user’s finger is not on the sensor.
Fig. 2 schematizes the operation of the MAX30100 device.

Fig. 2
The signals that are digitized by the signal processing block then become numeric and are sent on the I²C bus, from which they are read by our Arduino Uno, whose firmware, using a library specific to the sensor (called MAX30100.h), can calculate the heart rate and oxygen saturation in percentage value.
The processed data allow the preparation of data packets and commands with which we then control the small OLED display that will be our user interface, i.e. the panel on which we will see the graph of the trend of blood pressure (so the effect of the pulse of the heart) the heart rate and saturation detected by the sensor; all updated in real time.
The MAX30100 allows you to set, through the I²C bus and during initialization, the sample-rate and then the number of samples in the unit of time that the analogue/digital converter placed downstream of the analogue signal processor must perform: a higher frequency results in a more accurate analysis and display but increases the power consumption, while the reduction of the sample rate (and therefore the accuracy of the measure) results in a reduction of power consumption; this is appreciable and represents a compromise in applications where you want to create a portable saturation meter.
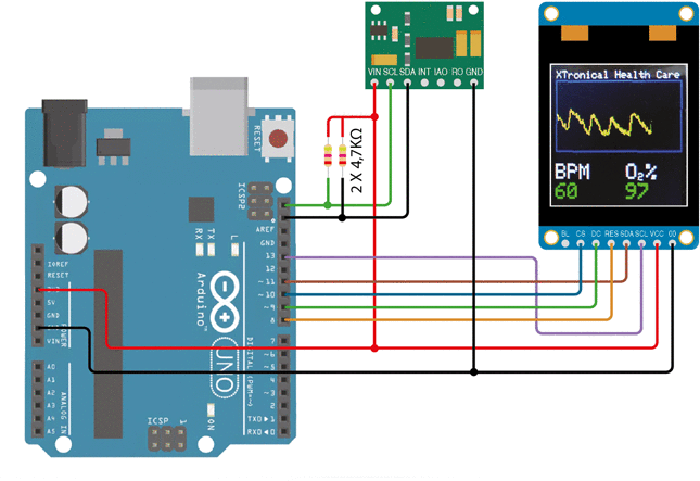
The complete circuit
Looking at the wiring diagram we see that the breakout board on which the Maxim sensor is mounted is connected to Arduino Uno by three wires plus ground and 5V power supply (taken respectively from GND and the 5V pin of Arduino Uno); the three lines are SCL and SDA of the I²C bus and INT, that is the open-drain interrupt output active at low level that signals the availability of data for reading. SDA and SCL lines are also open-drain, so it is advisable to provide pull-up resistors, which in the breakout board are 4.7 kohm but terminated on the internal power supply line.
The three lines each need a 4.7 kohm pull-up resistor to 5 volts positive, as the breakout board operates at 5 volts, although the MAX30100 operates between 1.8 and 3.3V; this is because on board the small board there are regulators for the component.
For this reason, since the Arduino Uno is internally powered at 5 volts and the I/Os operate at this voltage (but still capable of reading lower logic 1 levels), it would be convenient to remove the internal pull-up resistors and apply the external ones terminating on the Arduino Uno 5V line, as shown in the wiring diagram proposed in these pages.
To display the parameters on heart rate, saturation and heart rate trace, we used a miniature display TFT/IPS 1.44 “diagonal 128×128 pixels (the graphic area is 25.5 x 26.5 mm wide, so practically square) with serial interface to SPI type bus.
This display receives the data to be displayed prepared by the Arduino Uno sketch from the data received from the MAX30100 sensor and displays them.
For this purpose, the firmware initializes the Arduino Uno I/Os to work as a four-line SPI interface plus reset.
The display, being in full-colour IPS LCD technology, provides excellent contrast, excellent colour depth and a wide viewing angle of ±80°.
Its control electronics are based on the well-tested ST7735 controller, equipped with SPI data interface; the firmware management is simplified by the Adafruit_ST7735.h library.
The power supply of the module is between 3 and 5.5V and the connections are made through 8 pads on the bottom side, which can be soldered to common pin strip to facilitate the connections, since they are at 2.54 mm pitch.
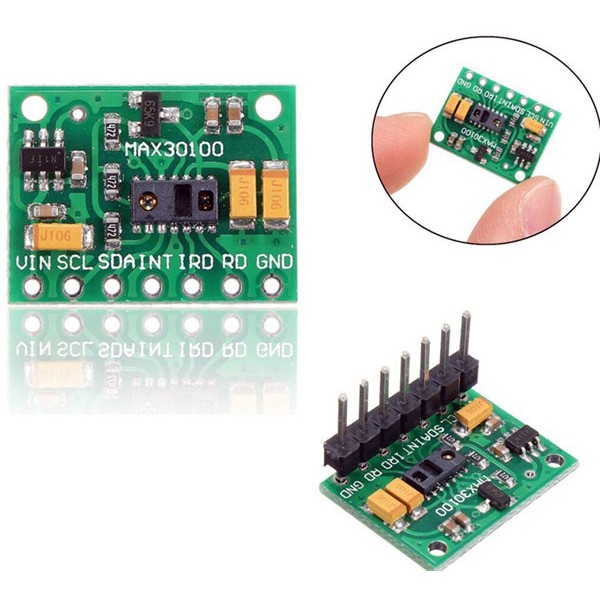
Fig.3
The meaning of the display connection pads is as follows:
GND = common ground;
VCC = positive power supply;
SCL = SPI clock;
SDA = SPI data line;
RES = reset;
DC = Data/command selection;
CS = Chip select signal, active at logic 0;
BLK = backlight control.
This last line allows you to turn the backlight on or off and can be left open if you do not want the backlight, while to turn the backlight on it must be set to logic zero.
Our display is marketed by Open Electronics under part number 3085-144ST7735.
The firmware
Well, now let’s spend a few lines on the sketch to load in Arduino Uno to run our saturation meter; for it we have taken inspiration from an idea of Xtronical (www.xtronical.com/ColourHeartMonitor) that allows, in addition to what is explained in these pages, also to drive a piezo buzzer with electronics to make it emit a beep every time the heartbeat is detected, as if you were performing an electrocardiogram. The beep can be useful for example if we use the instrument as a monitor for sports activities.
You can find the complete sketch in Listing 1; of it we note the inclusion of the MAX30100.h libraries to manage the breakout board sensor, the MAX30100_PulseOximeter.h to set the range of the sensor, the Adafruit_GFX.h which is a graphical library to draw the heart rate diagram on the display and the Adafruit_ST7735.h for communication with the display itself through the interface to the ST7735 controller.
Listing 1
#include “MAX30100.h” // Libraries required for the
#include “MAX30100_PulseOximeter.h” // MAX30100 range sensors
#include <Adafruit_GFX.h> // Graphics library for drawin on screen
#include <Adafruit_ST7735.h> // Hardware-specific library
// Recommended settings for the MAX30100, DO NOT CHANGE!!!!, refer to the datasheet for further info
#define SAMPLING_RATE MAX30100_SAMPRATE_100HZ // Max sample rate
#define IR_LED_CURRENT MAX30100_LED_CURR_50MA // The LEDs currents must be set to a level that
#define RED_LED_CURRENT MAX30100_LED_CURR_27_1MA // avoids clipping and maximises the dynamic range
#define PULSE_WIDTH MAX30100_SPC_PW_1600US_16BITS // The pulse width of the LEDs driving determines
#define HIGHRES_MODE true // the resolution of the ADC
// Create objects for the raw data from the sensor (used to make the trace) and the pulse and oxygen levels
MAX30100 sensor; // Raw Data
PulseOximeter pox; // Pulse and Oxygen
// The following settings adjust various factors of the display
#define SCALING 12 // Scale height of trace, reduce value to make trace height
 // bigger, increase to make smaller
#define TRACE_SPEED 0.5 // Speed of trace across screen, higher=faster
#define TRACE_MIDDLE_Y_POSITION 41 // y pos on screen of approx middle of trace
#define TRACE_HEIGHT 64 // Max height of trace in pixels
#define HALF_TRACE_HEIGHT TRACE_HEIGHT/2 // half Max height of trace in pixels (the trace amplitude)
#define TRACE_MIN_Y TRACE_MIDDLE_Y_POSITION-HALF_TRACE_HEIGHT+1 // Min Y pos of trace, calculated from above values
#define TRACE_MAX_Y TRACE_MIDDLE_Y_POSITION+HALF_TRACE_HEIGHT-1 // Max Y pos of trace, calculated from above values
// Pins to use with the 7735 display
#define TFT_CS 10 // Chop select
#define TFT_RST 9 // Reset
#define TFT_RS 8 // Register select
Adafruit_ST7735 tft = Adafruit_ST7735(TFT_CS, TFT_RS, TFT_RST);
 void onBeatDetected()
{
 // beep the beeper
}
void setup()
{
 tft.initR(INITR_144GREENTAB); // initialize a ST7735S chip, for 128x128 display
 tft.fillScreen(ST7735_BLACK);
 tft.setTextSize(1);
 tft.setTextColor(ST7735_WHITE);
 pox.setOnBeatDetectedCallback(onBeatDetected);
 // Initialize the sensor. Failures are generally due to an improper I2C wiring, missing power supply
 // or wrong target chip. Occasionally fails on startup (very rare), just press reset on Arduino
 if (!sensor.begin()) {
 tft.print(“Could not initialise MAX30100”);
 for(;;); // End program in permanent loop
 }
 tft.setCursor(0,0);
 if (!pox.begin()) {
 tft.println(“Could not initialise MAX30100”);
 for(;;); // End program in permanent loop
 }
 // Set up the parameters for the raw data object
 sensor.setMode(MAX30100_MODE_SPO2_HR);
 sensor.setLedsCurrent(IR_LED_CURRENT, RED_LED_CURRENT);
 sensor.setLedsPulseWidth(PULSE_WIDTH);
 sensor.setSamplingRate(SAMPLING_RATE);
 sensor.setHighresModeEnabled(HIGHRES_MODE);
 // Display BPM and O2 titles, these remain on screen, we only erase the trace and the
 // BPM/O2 results, otherwise we can get some flicker
 tft.setTextSize(2);
 tft.setCursor(0,86);
 tft.print(“BPM O”);
 tft.setCursor(92,86);
 tft.print(“%”);
 tft.setTextSize(1);
 tft.setCursor(84,94);
 tft.print(“2”); // The small subscriper 2 of O2
 tft.setCursor(1,0);
 tft.print(“XTronical Health Care”);
 tft.setTextSize(2);
 tft.drawRect(0,TRACE_MIN_Y-1,128,TRACE_HEIGHT+2,ST7735_BLUE); // The border box for the trace
}
void loop()
{
 int16_t Diff=0; // The difference between the Infra Red (IR) and Red LED raw results
 uint16_t ir, red; // raw results returned in these
 static float lastx=1; // Last x position of trace
 static int lasty=TRACE_MIDDLE_Y_POSITION; // Last y position of trace, default to middle
 static float x=1; // current x position of trace
 int32_t y; // current y position of trace
 uint8_t BPM,O2; // BPM and O2 values
 static uint32_t tsLastReport = 0; // Last time BMP/O2 were checked
 static int32_t SensorOffset=10000; // Offset to lowest point that raw data does not go below, default 10000
 // Note that as sensors may be slightly different the code adjusts this
 // on the fly if the trace is off screen. The default was determined
 // By analysis of the raw data returned
 pox.update(); // Request pulse and o2 data from sensor
 sensor.update(); // request raw data from sensor
 if(sensor.getRawValues(&ir, &red)) // If raw data available for IR and Red
 {
 if(red<1000) // No pulse
 y=TRACE_MIDDLE_Y_POSITION; // Set Y to default flat line in middle
 else
 {
 // Plot our new point
 Diff=(ir-red); // Get raw difference between the 2 LEDS
 Diff=Diff-SensorOffset; // Adjust the baseline of raw values by removing the offset (moves into a good range
for scaling)
 Diff=Diff/SCALING; // Scale the difference so that it appears at a good height on screen
 // If the Min or max are off screen then we need to alter the SensorOffset, this should bring it nicely on screen
 if(Diff<-HALF_TRACE_HEIGHT)
 SensorOffset+=(SCALING*(abs(Diff)-32));
 if(Diff>HALF_TRACE_HEIGHT)
 SensorOffset+=(SCALING*(abs(Diff)-32));

 y=Diff+(TRACE_MIDDLE_Y_POSITION-HALF_TRACE_HEIGHT); // These two lines move Y pos of trace to approx middle of display
area
 y+=TRACE_HEIGHT/4;
 }
 if(y>TRACE_MAX_Y) y=TRACE_MAX_Y; // If going beyond trace box area then crop the trace
 if(y<TRACE_MIN_Y) y=TRACE_MIN_Y; // so it stays within
 tft.drawLine(lastx,lasty,x,y,ST7735_YELLOW); // Plot the next part of the trace
 lasty=y; // Save where the last Y pos was
 lastx=x; // Save where the last X pos was
 x+=TRACE_SPEED; // Move trace along the display
 if(x>126) // If reached end of display then reset to statt
 {
 tft.fillRect(1,TRACE_MIN_Y,126,TRACE_HEIGHT,ST7735_BLACK); // Blank trace display area
 x=1; // Back to start
 lastx=x;
 }
 if (millis() - tsLastReport > 1000) // If more than 1 second (1000milliseconds) has past
 { // since getting heart rate and O2 then get some bew values
 tft.fillRect(0,104,128,16,ST7735_BLACK); // Clear the old values
 BPM=round(pox.getHeartRate()); // Get BPM
 if((BPM<60)|(BPM>110)) // If too low or high for a resting heart rate then display in red
 tft.setTextColor(ST7735_RED);
 else
 tft.setTextColor(ST7735_GREEN); // else display in green
 tft.setCursor(0,104); // Put BPM at this position
 tft.print(BPM); // print BPM to screen
 O2=pox.getSpO2(); // Get the O2
 if(O2<94) // If too low then display in red
 tft.setTextColor(ST7735_RED);
 else
 tft.setTextColor(ST7735_GREEN); // else green
 tft.setCursor(72,104); // Set print position for the O2 value
 tft.print(O2); // print it to screen
 tsLastReport = millis(); // Set the last time values got to current time
 }
 }
}
Conclusions
Well, with this we believe we have explained everything you need to make and use the saturation meter correctly; as well as at home, as a fixed diagnostic tool, you can use it in outdoor sports by mounting it on a rubber thimble, replacing Arduino Uno with an Arduino Micro or Nano to be placed, for example, in a case to put on a jacket or applied to a shirt (connecting everything with a thin multi-wire cable) in order to create a real heart rate monitor with integrated saturation meter, perhaps able to store the tracks of the physical activity carried out in a training session.
From Openstore
1.44 Inch Color TFT Module ST7735
Pulse Oximeter and Heart-Rate Module MAX30100

What are the dimensions of the break-out PCB?
We are guessing 2.0 CM x 1.5 CM.
We like this idea and wish to buy the parts.
Hi, here the module https://store.open-electronics.org/PulseOximeterSpO2andHeart-RateSensorModuleMAX30100-2846-MAX30100BRK