Make use of an ad hoc module by AMS in order to make a precious Arduino based tool. It will allow analysis of materials, including food and drink, through the spectrum obtained with a light stimulus and a sensor, and shown on the serial monitor.
Spectrometry is an analysis technique that enables the identification of material chemical composition, regardless if they are solid or liquid, using the absorption and emission of an incoherent light that hits the surface. It’s used in every chemical and biological laboratory, but it can be helpful also in domestic and everyday life: for example, using the spectral response, we can separate a good wine from a bad one, or an extra virgin olive oil from a normal one.
In these pages, we offer you information to build a homemade spectrometer capable of emulating the ones you can find in technical laboratories (with, of course, a lower precision) that enable you to try spectroscopy at home. This is a low-cost project that relies on only a few components and therefore does not have a fancy user interface, such as a display. Instead, data will be “plot” on Arduino serial monitor and can be processed in a graphic form afterwards with the use of a PC.
SPECTROMETRY
Before getting to the heart of the project it is appropriate to explain what spectrometry is. Let’s start saying that the light that our eyes see (the one our brain is able to interpret) is, actually, a portion of what the sun sends and it travels within a wide range of frequency called spectrum. Our eyes sense only a small portion of the solar spectrum that’s called visible spectrum or visible light. By chance the visible spectrum is exactly the subset of frequencies with high intensity; in reality, it’s not by chance, but the result of the evolution of the human eye that, over millennia, got used to detect the most important part of the spectrum of light that strikes our planet.
When light hits an object and it’s not fully absorbed (otherwise we’re talking about the so-called black body) apart returns back: this is an optical phenomenon known as reflection. If this reflected light is in our sight and brings some of the frequencies of the visible spectrum, then we see the corresponding colour.
So, when we see a green leaf, it means that the leaf absorbed every frequency with one only exception: the green component, an electromagnetic radiation with a frequency of about 520nm. You can see visible spectrum frequencies, and the related colour perceived, inFig.1.

Fig.1
Reflected light brings other information apart from colour: if we illuminate a material with white light (that is the whole set of visible frequencies) and it reflects only violet light, this means that all others frequencies were absorbed. The set of frequencies that an object holds back is called absorbed spectrum and, since every material has a well know absorbed spectrum, this becomes a unique identifier of the material itself. This notion is important enough to have earned a specific physics branch that studies the interaction between matter and electromagnetic radiation called spectrometry, and the instrument used to measure this interaction is the spectrometer.
TECHNOLOGY
In order to build a spectrometer, we need something to illuminate the object under analysis, and something capable of catching the reflected light from the object. It’s not mandatory to have a collimated ray of light, like a laser, but a normal beam works fine, even with a certain angular opening. Producing this kind of light is easy enough: a LED is everything you need; catching and recording the reflected light is a different matter. Here a photodiode comes in handy, which, when it’s hit by a photon (that is the elemental particle of light) an electrical current begins to flow. The more intense the light radiation that strikes the photodiode, the more intense is the current created (within the components limits of course).
With the photodiode, we can catch the reflected light and measure its intensity, but to calculate the spectrum we need to know exactly which wavelengths are contained in that light. To do this we need to filter the beam of light before it hits the photodiode, dividing it in many beams of known wavelengths that will cover the spectrum of interest.
Various filter exists in electronics, in this case, a Gaussian bandpass is used. Let’s use an example to explain what we’re talking about: one channel measures the wavelength around 610nm (each channel is correlated to a different wavelength). The reflected light hits the sensors, is filtered to let pass through only the radiation with a wavelength similar to 610nm, and strike the photodiode; so that photodiode (channel) tells us only how much radiation of that specific wavelength is in the reflected light. The Gaussian bandpass filter lets through 100% of the target (in this case wavelengths at exactly 610nm) and a decreasing percentage of light at frequencies above and below 610nm. The result will be a Gaussian curve, similar to a bell, as you can see in Fig.2.
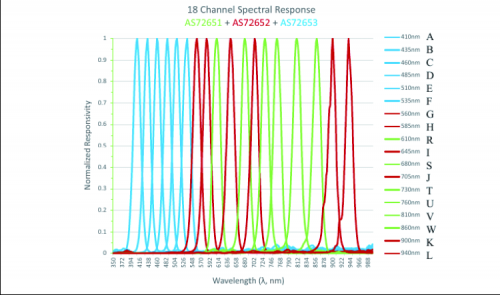
Fig.2
Each one of the 3 sensors in our project calculates 6 different wavelengths, for a total of 18 channels. After the measurement, there’s an integration computation made by the firmware, and at the end, we’ll be able to obtain the spectrum from 350nm (violet) to 1000nm (NIR: Near Infrared Range) that covers the entire visible spectrum plus a little bit of near infrared. This will be enough to obtain a spectral blueprint unique for most common materials. (fig.3)

Fig.3
AMS AS7265X SENSORS
At this point, it is important to understand the details of the light sensor used. AMS produces a set of 6 channels digital spectrometers: AS72651, AS72652 and AS72653. Every channel is optimized to capture the intensity of a small range around a determined wavelength with an FWHM (Full Width at Half Maximum) of 20nm. Table inFig.4 shows the measured wavelength for each channel and to which sensor they belong.

Fig.4
AMS Moonlight system is the project from which we were inspired to achieve our spectrometer. There are 3 AMS AS7265X sensors integrated and controlled by AS72651 which mount a microcontroller that enables communication with a smart interface. AS72651, in order to serve as master, utilizes the built-in flash memory with the Moonlight firmware.
Fig. 5 is a schematic of the system: as you can see, each sensor is built within a semiconductor chip which receives external light through a focusing lens and on the same chip are the electronics that convert light radiation in a digital signal.

Fig.5
Fig. 6 shows the block diagram, in which we can distinguish the light spectral sensor (that is the core of the system), communication circuit by I2C bus and the one that controls the LED used for to generate the light needed to illuminate the element we want to analyze.

Fig.6
Each sensor is powered with a tension of 3.3Vcc with little tolerance, about +/-10%.
The sensor supports two different communication protocols: I2C bus register or through AT commands and a UART interface. AT commands are an easy enough protocol for communicating on a serial bus. Each command is a string of character beginning with “AT” and finishing with a Carriage Return (CR character and New Line (NL character). The most useful AT commands implemented inside the Moonlight system are:
AT: verify that the system is communicating correctly, replay “OK”.
ATDATA: returns all the 18 values of the channels, in sensor order. That means first is AS72561 channels, then AS72652 and last AS72653.
ATXYZR: return the 18 values of the channels in wavelength order.
ATTEMP get the temperatures of each sensor (operating range is from -40°C to 85°C).
ATVERSW: returns firmware version.
ELECTRICAL SCHEMATIC
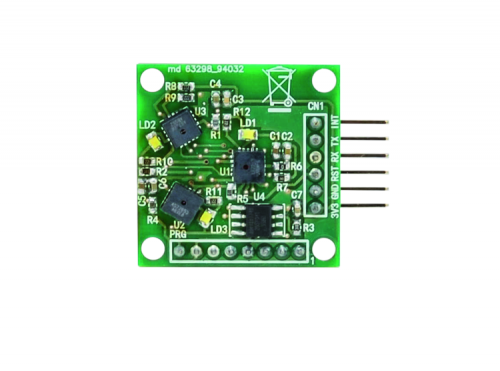
Schematics are provided to understand how AMS sensors are integrated. In it, we can see the 3 sensors that are very different because each covers a different range of the light spectrum. Specifically it has AS72651 (labeled U1), AS72652 (U2), AS72653 (U3), a Flash Eprom AT25SF041 (U4) by Atmel with 4Megabit of memory, and dual I/O that mount the Moonlight Firmware (the one of the Moonlight system) and is connected with the master sensor (U1) through a 4 way SPI bus (MISO, MOSI, DI and CLK).
Communication with the external environment is made with the wiring on the PRG connector, which is also useful for in-circuit programming, The task of the master is to collect information from all the sensors and send them out. This happens through a 3 way I2C bus where SDAS is the bidirectional data line, SCLS is the clock for synchronization and the RESET is handled by the master AS72651.
With the DRV line, each device commands an LED linked to the power line through a current limiting resistor. This LED can be turned on followed by the catching sensor for the reflected light, so each LED is synchronized with the respective sensor.

AS72651 is the interface with Arduino via connector CN1 that contains: UART line with RX on pin 4 and TX on pin 5, RST line (3), INT (6) and the power line (3.3V) provided by the relative pin on Arduino and the common mass GND. For the connection with Arduino refer to wiring drawing below. In this case, the serial communication is wired to pin 10 and 11 and it needs to be declared using the software library newsoftserial.h included in the sketch.
To be noted, AS72651 can talk both via I2c bus or UART, the selection is made by pin 8 (I2CE) that, set on logic 0 enables communication with I2CE, otherwise set on 1 enables serial TTL UART. In our case pin, 8 receives the logic level that set UART from the resistive divider composed on R6 and R7.

Fig.7
PRACTICAL REALIZATION
Now we will explain how to assemble this project with an understanding that the breakout board has to be self-made and has to be connected to an Arduino Uno board using the wiring drawing. For the breakout board, a double-sided printed circuit board is needed that can be done with photogravure starting with the copper side tracks downloadable from our site www.elettronicain.it. After engraving and perforating the PCB, you have to place the components that are SMD, so you need the proper equipment and a lot of caution to mount them, especially the 3 light sensors that have an LGD type case (with pad pin placed under the case) that requires a particular procedure.
You will need a soldering station with an iron of 20 to 25W with a very small point, soldering alloy wire with a maximum diameter of 0.5mm, tweezers for components placing, a magnifying glass, solder paste and a medium intensity flux.
To mount the 3 sensors, you must first tin the pads on the PCB by melting a sphere of diameter 0.6mm over every BGA chip place, this procedure can be done with a hot air soldering station after apply flux on the pads (a very dense one that holds the sphere in place till the end of the melting) and the sphere over the flux.
At this point you have two ways to proceed:
1) putting the PCB over a heating plate that brings the board to 140°C, with already mounted the sensors (each in the correct place and orientation given by the assembly plan you can find on this pages) and then blowing with hot air (about 250°C) till the components start to lean against the solder;
2) warming the PCB, with mounted sensors, and blowing hot air with a slightly lower temperature and waiting for the components to lay down on the solder, as before.
Otherwise, you can avoid using the spheres directly soldering the pads of U1, U2 and U3, then lay some flux, apply the sensors and finally warming with hot air, better if with soldering paste, in this case, apply the paste after the flux.
Using the heating plate is the best practice because it will reduce the exposure time of the board to hot air, reducing thermal stress and increasing the life of the sensors themselves.
After the sensors are placed, continue with all the other components, first the passive ones and then set the Flash memory in SMD.
The only components with traditional assembly are pin-strips with a 2.54mm step for connections, convenient also if you want to integrate the breakout board on a PCB.
For an easier soldering, we advise applying flux on every pad before proceeding with melting solder.
ARDUINO LIBRARY
The library is able to read all 18 channels in one step and save them in the 3 arrays, each one representative of one AMS sensor. Each value is assigned to a name, or better a letter has shown inFig.4 (that also indicates how to call the parameter from the library), but you need all 18 values in order to make a spectrum sufficient to make the acquisition unique for that material. The library is downloadable from our site www.elettronicain.it where you can also find all the others files related to this project. After unzipping it you have to create a folder with the same name of files .cpp and .h.
Now you can connect your Arduino, as shown in the drawing, and copyListing 1 in a new sketch. The serial monitor will show something like:
410;435;460;485;510;535;560;585;610;645;680;705;730;760;810;860;900;940
3;3;117;72;0;0;446;347;121;131;72;71;13;16;17;10;8;5
3;3;116;72;0;0;446;346;121;131;72;70;13;16;17;10;8;5
6;22;54;34;25;3;253;75;79;17;9;66;26;8;6;4;3;1
6;25;61;33;26;3;244;81;37;17;9;83;16;7;6;4;3;1
Where, after a small introduction, a text will appear that, if copied in a CSV file, will allow you to create a ready to use spreadsheet with yours tests. In the code portion above there are 2 sample for 2 specimen, as you can see there’s a small variability in each measurement but it can depend on a lot of conditions: ambient light, closeness, light noise and others environmental factors.
Let’s explain what happened by referring to Listing 1. In row ams->setLedsOn(); we have turned on the LEDs, then in row len=ams->getWavelengthStr(str,’;’); is called the library function that returns the string with the 18 wavelengths, sorted by wavelength itself, semicolon separated, this will work as CSV header.
Listing1
#include <AMS_Spectrometer_lib.h>
#include <SoftwareSerial.h>

AMSSpectrometer *ams;
char str[CSV_LINE];
unsigned int len;

void setup() {
  Serial.begin(115200);
  while (!Serial) { ; }
  Serial.println(“AMS spectrometer”);

  ams = new AMSSpectrometer();
  delay(100);
  ams->setLedsOn();
  delay(100);
  len=ams->getWavelengthStr(str,’;’);
  Serial.print(str);

  delay(200);
}

void loop() {
  len=ams->getVal_CsvSemicolonSep(str);
  if (len!=0) Serial.print(str);

  delay(3000);
}
In the loop, every 3 seconds, the 18 values are read and print in the serial monitor if and only if the read was successful. Whenever you sample a different material this string will change giving you the spectrum of the object. Note that the distance of the sensor to the sample can’t exceed 10cm, due to the reduced LED power. Additionally, it is required that the inclination is lower than 25°.
The values for every wavelength represents of how much radiation hit the sensor. The whole string represents the spectrum of the sample.
The library offers a lot of useful functions, some of them are exemplified inListing 2, each example commented. However, in the library, you can find an explanation for every function.
Listing2
/* EXAMPLES OF USE
* These statements apply to all the examples below */
#include <AMS_Spectrometer_lib.h>
#include <SoftwareSerial.h>
char str[CSV_LINE];
unsigned int len;
char str_fancy[200];
int a[3];
AMSSpectrometer *ams;


/* FANCY STRING
* print the values of the 18 channels legibly, instead of CSV format */
len=ams->getVal_FancyStr(str_fancy);
if (len!=0) Serial.println(str_fancy);

/* SINGLE VALUES
* reads the values of the 18 channels, after which he prints them one by one */
ams->readChannels();
for (len=0;len<6;len++) {
    Serial.print(ams->ch_1[len]);
    Serial.print(F(“ “));
}
for (len=0;len<6;len++) {
    Serial.print(ams->ch_2[len]);
    Serial.print(F(“ “));
}
for (len=0;len<6;len++) {
    Serial.print(ams->ch_3[len]);
    Serial.print(F(“ “));
}
Serial.println();

/* SENSOR TEMPERATURE
* print the temperature of the 3 sensors, in degrees Celsius */
if (ams->getGain(a)) {
    Serial.print(F(“numbers: “));
    Serial.print(a[0]);Serial.print(F(“, “));
    Serial.print(a[1]);Serial.print(F(“, “));
    Serial.print(a[2]);Serial.println(F(“. “));
} else Serial.println(F(“error”));

/* FIRMWARE VERSION
* print the installed firmware version */
len=ams->sendATcommand(“ATVERSW”,str);
if (len!=0) Serial.println(str);
SPECTROMETER USAGE (WHAT’S A SPECTROMETER?)
With AMS sensors AS7265X we can build a home version of a spectrometer, for now, it won’t graph our results because there’s no display, but it can be used to distinguish one material from another, thanks to the 18 channels.
With this very easy project, and mostly without a prefilled database, a portable spectrometer can come in handy as colourimeter (there are websites that translate wavelengths values in RGB code) or, better, for “branding”. This means to identify a specific brand (or formulation) of a given substance. This can be used to identify counterfeit products. For example printer ink. They all seem the same, but if you want to compare products to see if they are different, you need a deeper analysis beyond your sight. This can be done with every kind of product, be it solid, liquid or gas, finding applications in farming, breeding, building, manufacturing, pharmacology, and many others. Think about a construction company that wants to maintain a standard in its concrete. With the help of a spectrometer, it is possible to identify the right cement from the supplier and can preserve the percentage of the ingredients for the mixture.
In cooking a spectrometer can be used to analyze different kinds of oil in order to distinguish an extra virgin olive oil from a standard one, as well as to reveal the use of additives like chlorophyll (used to cover oxidation) or beta-carotene, which are substances that you may not know are in the ingredients. By creating a database of samples you increase the chances that you can pick out true bio fruits and vegetables, or separate a true jewel from a plastic version.
Another use is in analyzing the ambient light. Some plants, in order to grow well, need specific wavelength in the environment. So if you want to create a greenhouse of non-native plants you can use the spectrometer to measure the growing light source to ensure it is correct. In this specific case, you have to turn off the LED, increase gain and integration time (exactly like a camera) and you’ll be able to have the spectrum of the ambient light, so you’ll know which wavelengths are prevalent. Correct lighting is also important for reptile houses.
All the function you need to do this are inside the library we describe above, including the one you have to use for handle exposure time (for both LED illuminance and absorbed spectrum observation).

DIRECT MANAGEMENT BY PC
Up to this point, we described using the spectrometer sensors through an Arduino. However, the board with the 3 AMS sensors integrated can be interfaced directly to a PC via TTL/USB converter like USBTOUART, then handled with classical AT commands that, this time, we send through a terminal emulator like Hyper Terminal. So it’s possible to use the spectrometer directly from a PC without the use of an Arduino.
Also, for those who have a bit of experience with Windows application, it’s possible to develop software in Visual Basic that graph then spectrum chart observed by the breakout board, thus integrating the device in a custom application program. Obviously, this works also for another operating system, first of all, Linux based one, that are open and, by definition, it’s very easy to create personalized software on them.
The wiring is well-described inFig.8.

Fig.8
CONCLUSION
The device described in this article is a low-cost solution to create a portable version of a spectrometer with which it’s possible to do a new level of analysis useful from the DIY to work application as well as for the educational environment.
From openstore
Spectrometer breakout – mounted

how to analysis the food or fruit contents like fat carbohydrates,sugar etc by getting the 18 channel signal
LET’S BUILD A SPECTROMETER
the program does not run.. or the library is wrong or something is missing
LET’S BUILD A SPECTROMETER
led not open