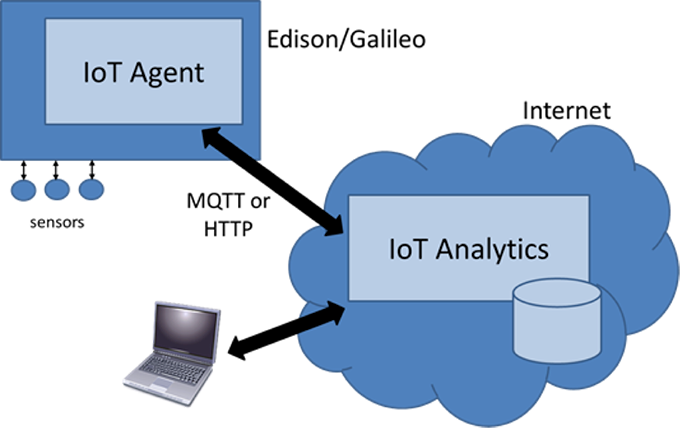
Intel provides a nice feature dedicated to its IoT boards users: the IoT Analytics portal. IoT Analytics includes resources for the collection and analysis of sensor data that the Intel® IoT Developer Kit provides without having to invest in large-scale storage and processing capacity. While it is possible to store sensor values directly on an Intel® Edison board, IoT Analytics is the preferred, convenient location for storing sensor values for safekeeping and future manipulation.
This guide shows IoT developers how to access and take advantage of this valuable resource. Several elements are necessary in this multi-step process. Setting up an IoT Analytics account first and then proceeding with connectivity and sensors is the best pathway to success. Your device must be able to access the internet so that it can connect to the cloud. Networks with ports blocked, or firewalls may see difficulty in connectivity. Two pieces of software are involved on the device, one to collect data, the other to send data. This document will emphasize connectivity to the IoT Analytics site first (with device), then to collect data to send.
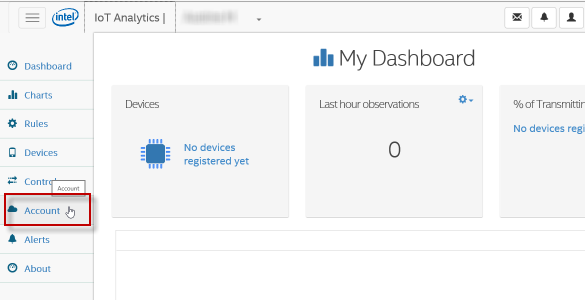
The My Dashboard page provides access to all system functions, including the number of devices, the number of observations received in the past hour, and the percentage of devices that are “healthy,” meaning they have transmitted data recently. You can customize the lower section to show a “favorite” chart, which contains a chart of specific time series from specific devices:
Source: Intel® IoT Platforms: Getting Started: Cloud Analytics | Intel® Software
