
When the instantaneous power consumption exceeds the set values, it selectively disconnects the users, in order to prevent the electric meter to cut the power to disconnect.
The management of the electricity users at home, intended as the possibility to define the operating priorities and to momentarily disconnect the ones that may be “sacrificed”, is something that has become important since the coming of the electronic meters. With respect to the traditional ones, such meters are in fact a bit less tolerant towards the overloads, and they could suddenly leave us without power. Given that nowadays the electric meter is almost always outside and that in order to rearm it we should get out of the house; not to mention that the disconnection will probably turn off the computer that is sending files via the Internet, or that a user might not be able to shut down. In order to prevent such a situation, we created the load manager: in the previous installment, we described its hardware. It is now the moment to deal with the software governing it, and with the management of its functioning via the user interface.
FIRMWARE
Let’s start by describing the firmware loaded in the PIC18F46K22 microcontroller and the functions it makes available as for the management of the electric measures; the firmware has been developed in the MPLAB X IDE (in the 4.0.1 version) by Microchip, while we used the rev. 3.37.01 C18 as a C compiler. The code has been divided into different files, so to have an orderly and easily maintainable environment: for each .C file that is created, there is a corresponding .H one. As for the description of the firmware, we will start with the main flowchart shown in Fig. 2, that concerns the code found in the “Main.c” file. There are three distinct blocks, of which the first two are initialization ones, while the third one includes the operating functional code.
The first block initializes the peripherals found on the microcontroller; in particular, there are:
- the initialization of the internal oscillator; the microcontroller has been configured so to operate at a 64MHz frequency, that enables an actual processing speed of 16MIPS;
- the initialization of the SRAM memory;
- the initialization of the I/O and analog ports;
- the initialization of the unused peripherals;
- the initialization of the EEPROM memory;
- the initialization of the SPI, I²C and UART communication peripherals;
- the initialization of timers and interrupts.
Once the microcontroller initialization has been completed, it moves onto initializing the peripherals connected to it, and in particular, it runs:
- the initialization of the LCD screen, according to the sequence recommended by the manufacturer;
- the backlight activation;
- the activation, in sequence, of all the non-primary outputs; the outputs are activated, one by one, with a pause between a starting and the next one, so to avoid possible absorption peaks in the electric system, in the case in which there were some loads connected to the lines;
- the initialization of all the state machines needed in order to manage the different firmware tasks.
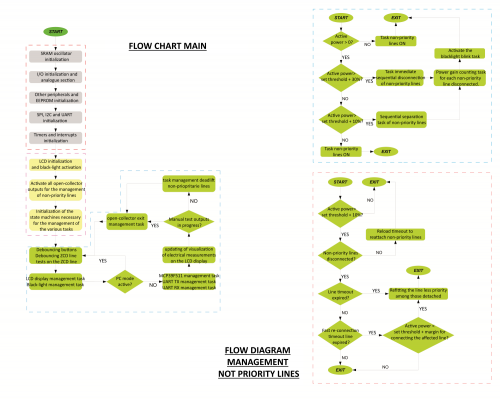
Fig. 2
Once the initializations have been completed, the firmware enters an infinite loop in which the different tasks needed for the management of all the available functions are recalled. Therefore, the digital inputs to which the five buttons (with pertaining debouncing) and the control on the ZCD (Zero Crossing Detection) line will be read, in order to verify that there is a voltage as for the connected line.
This is followed by the management task of the LCD screen, concerning the visualization of the different management and configuration menus, among which the backlighting one. Thereafter the system carries out a test in order to see if the “PC” mode has been activated; during the latter, the system does not execute the control tasks as for the power and related disconnection of the non-primary lines, in the case of a threshold being exceeded. When in this mode, it is possible to connect a PC to the FT1346M measuring board, by using the specific connector and the usual FT782M USB serial converter. Once the system has been connected to the PC, you will be able to use the software shown in the article concerning the Energy Meter project (issue 220), so to monitor the electricity consumption of the electric system. For example, it is possible to verify – in real time – the consumption of some appliances, such as ovens, washing machines, air conditioning and so on.
If on the other hand, the system is not in the “PC” mode, all the following tasks will be executed; among them, there is the management of the MCP39F511 integrated circuit by Microchip, that is mounted on the FT1346M board; the integrated circuit is connected to the microcontroller via the UART interface.
The following task deals with updating and displaying the electrical measures on the LCD screen, depending on the selected menu page. The measures are always displayed, two by two; for example the RMS voltage and current. At the next step, the firmware will verify if the test mode of the non-primary outputs has been activated; if so, the system skips the monitoring tasks as for the measured power and the disconnection of the non-primary lines; in the opposite case, even those tasks are executed. Lastly, there are the management tasks as for the open-collector outputs, to which the relays for the management of the non-primary lines are connected. At this stage, the cycle is restarted from the beginning and goes on forever.
It is worth to analyze the algorithm flowchart, that deals with the disconnection of the non-primary lines in the case in which the power threshold is being exceeded; that’s the part below in Fig. 2. Let’s start with the first diagram. The algorithm for the disconnection of the non primary lines reasons in terms of two thresholds to be considered when defining the intervention: the first one if the nominal power of the electric panel, adding +10%, while the second one is the power of the electric panel adding +30% (actually, it would be +33%, but we prefer to have a 3% margin). From the flowchart, it is possible to see that the algorithm ensures that the measured real power has a positive sign, that is to say, that there is electric energy consumption; in the opposite case, the algorithm executes the task in order to disconnect – if needed – the non-primary lines.
If the measured real power is positive, it means the electric system is absorbing energy and therefore the disconnection algorithm will start to operate; as a first thing it verifies if the real power exceeds the set threshold at 30%, should it be the case, the algorithm will disconnect the non primary lines in an ultra quick way, starting from line 1 and all the way up to line 7.
For each disconnected line, and before moving to the next one, the system will verify if the real power went below the two threshold levels, and it will go on to disconnect the non-primary lines.
Every time a non-primary line is disconnected, the system carries out a measuring, in order to evaluate the power gain that is obtained after the disconnection, and it considers that, during the re-arming stage of the non-primary lines. Every time a line is disconnected, the system makes the backlight of the LCD screen flash, so to indicate that the system came into action, because of an excessive electric energy consumption.
But let’s get back to our diagram: as mentioned before, during the disconnection stage the algorithm carries out a first test, in order to verify that the +30% power threshold has not been exceeded; in the case this didn’t occur, the system will test that the +10% power threshold has not been exceeded. If the said threshold is exceeded, the system starts to disconnect the non-primary lines with a time interval of about 4 seconds between a disconnection and the next one, and therefore in a much slower way with respect to the previous case.
For each disconnected line, the system evaluates the power gain to be considered for when the rearming algorithm will come into action.
Let’s examine the second flowchart now, that describes the algorithm for the rearming of the non-primary lines, in the case in which the measured real power allows it. As a first thing, the algorithm must ensure that the measured real power is below the set threshold (therefore, to be clear, that’s the power of the electric meter, adding +10%); if it weren’t so, the algorithm wouldn’t carry out any action. If the measured power is below the threshold, the algorithm verifies if there are some disconnected non-primary lines; in the case in which the lines are already all connected, the algorithm limits itself to recharge some system time-outs and it doesn’t execute anything. Vice versa, if there are some disconnected lines, as a first thing the algorithm verifies if the rearming time-out (that may be set by the user) has expired, and if so, it tries to rearm the non primary line, starting from the least significant (line 7) one and until the most significant (line 1) one is reached.
However, if the rearming timeout is not yet expired, the system verifies that the ultra quick rearming timeout (that is different from the previous one) is expired; if so, it runs a test in order to verify if – as for the primary line that it is going to rearm – there is enough power margin to do it, with respect to the set threshold, otherwise it won’t try any rearming. At the moment in which all the non-primary lines have been rearmed, the LCD screen’s backlight will stop flashing. Let’s continue now with an overview on the menu, that has been developed in order to enable the user to interact with the system by means of the five buttons that have been coupled with it. Fig.3 schematizes the User Menu, as shown by the display; the picture shows the screens corresponding to all the available configuration menus and the related submenus, in detail.
An identification number has been assigned to each menu page, so to facilitate its description and recognition.

Fig. 3
During the powering up, the “Sequence for loads activation” indication is shown on the LCD screen; it warns the user that the system is initializing the open-collector outputs for the purpose of the activation of the non-primary lines. The activation of the lines occurs in a sequential way, with a waiting time between a line and the following one, so to prevent possible absorption peaks. Once the initial stage has been completed, the “Home” screen is shown: it is indicated as the “0” page, in which the firmware revision is shown. In this case, the “Energy Meter Rev. 1.0” indication will appear. From this starting page, it is possible to recall the display pages as for the electric measurings in progress, or to recall two configuration submenus. Let’s start with the submenus. The first one (Page “8”) is needed in order to configure the contrast of the LCD screen; to make it appear you will have to press the P3 button for more than 3 seconds. In this way, the “SET LCD CONTRAST” indication will appear at the first line, while at the second line a bar will appear, so to show the contrast level set. By means of the P1 button, the contrast value decreases, while via the P5 button it increases. Once the best value has been reached, please press the P3 button to exit and save.
If – on the other hand – the P3 button is pressed for more than 6 seconds from the page “0”, the “PC mode” submenu (Page “9”) will be recalled and the “PC mode enabled! Connects your PC” indication will appear on the display; at this stage, it will be possible to connect the PC to the measuring board, by using the FT782M USB/Serial converter. Thanks to the “EnergyMeter R.1.0.3.0” software (or to a superior one) it will be possible to display the trend of the electric energy consumption of the electric system, so to obtain an estimate of the consumption and so to decide which lines of the electric system should become non-primary ones. This mode may also be used in order to calibrate the measuring board again if needed. In order to exit this mode, you will have to press the P3 button again. By pressing the P5 button from the page “0”, the page “1” will be recalled; the latter will display the RMS voltage and RMS current measures.
Now, by pressing the P1 and P5 buttons from this page, it is possible to navigate the pages displaying the electrical measures. Page “2” displays the real and apparent power quantities, page “3”displays the measures as for the active and reactive power, page “4” shows the measures concerning the power factor and the network frequency, while page “5” displays the statuses of the non primary lines, with the “C” (Close) letter indicating a connected non primary line, while the “O” (Open) letter indicates a disconnected non primary line and the “F” (Forced) letter indicates a forcibly ON non primary line. Finally, pages “6” and “7” respectively display the real and reactive imported energy and the real and reactive exported one.

Now, let’s return to page “2”, where the real and apparent power is displayed; it is possible to recall two configuration submenus from this page. The first one is needed in order to set the power threshold for the disconnection of the non primary lines (page “10”); in order to recall this page you will have to press the P3 button for more than 3 seconds, so that the “SET PW THRESHOLD ” indication will appear at the first line, while at the second one there will be “EM – THR: xxxxx ”; as for the latter, the power threshold will be shown in the place of the xs. As per default settings, the power is 3kW, as in the greatest part of the electric meters that are installed in the houses. By means of the P1 button, the power threshold is decreased, while via the P5 button the threshold power is increased. We would like to point out that you should specify the nominal power value of your electric meter, that is to say, 3kW, 4.5kW or 6kW. The system will automatically calculate the two power thresholds, to which +10% and +30% will be added. You might obviously decide to specify power thresholds that are different from the ones of the installed electric meter; it is important however to keep in mind that the two intervention thresholds are automatically calculated.
It is, therefore, inadvisable to specify values that are greater than the installed power of your electric system, that’s in order to prevent that the system comes too late into action, thus making the electric meter disconnect; that’s exactly what we would like to prevent by means of a system for the disconnection of the non primary lines.
In order to exit and save the set value, you will have to press the P3 button again. The second submenu (page “11”) – that may be recalled from page “2” – is needed in order to set the time the system has to wait before trying to connect again a non-primary line that has previously been disconnected. The preset time is 120 seconds, the minimum time that may be set is 30 seconds, the maximum time that may be set is 300 seconds. The page displays the “SET LOAD Toff” indication at the first line, while at the second line there is “Toff: xxx Sec”, in which the timeout value in seconds is in the place of the Xs. In this page, by means of the P1 button, the time-out value is decreased, while via the P5 button it is increased. By means of the P3 button, the set value is saved and you are returned to the menu’s page “2”.
From page “5”, where the statuses of the open-collector outputs are displayed, two submenus may be recalled. The first one is needed in order to set forcibly ON the open-collector outputs; a forcibly ON line means that the algorithm designated for the disconnection will not be able to operate on this primary line, and will, therefore, move on the next one. This function has been studied since there are some situations in which a certain line must not be disconnected; for example, a cooking cycle must not be stopped; hence, it depends on the cases and on how your electric system is configured.
In order to recall page “12”, you will have to press the P3 button for more than 3 seconds; in this way, the submenu will appear and the “LOADS STATUS” indication will appear at the first line, while the statuses of the different open-collector lines will be at the second line. As aforementioned, the “C” letter indicates a Close status, the “O” letter indicates an Open status and the “F” letter indicates a Forced status. The seven lines that are displayed are shown, starting from line 1 on the left and all the way to line 7 on the right. The flashing cursor deals with indicating which line is selected; it appears as soon as you enter this submenu.
The P1 button moves the cursor on the next line to the left, while the P5 button moves the cursor to the next line to the right. As aforementioned, the flashing cursor indicates the selected line. Once the line on which you want to operate has been selected, please press the P4 button in order to have the line forcibly ON, and the “F” letter will appear. In order to return the line to its initial state, please press the P2 button. In order to exit the submenu, please press the P3 button.
From the “5” menu page, it is possible to recall the second submenu, by pressing the P3 button for more than 6 seconds (Page ”13”). From this submenu, it is possible to test the non-primary lines or to connect/disconnect them at leisure, so to verify their functioning. When this submenu is recalled, the “LOAD TEST” indication will appear at the first line. As for the previous submenu, a flashing cursor will indicate which line has been selected and its status, that may be “C” as in Close or “O” as in Open. While in this submenu, the algorithm for the disconnection of the non-primary lines is disabled. The P1 button moves the cursor to the next line to the left, while the P5 button moves the cursor to the next line to the right. By means of the P2 button, the “C” Close line is forced, while by means of the P4 button the “O” Open line is forced. By means of the P3 button, you will exit the submenu and return to the “5” page.
The last submenu may be recalled from the pages “6” or “7”, it is needed in order to reset the counters of the accumulated energies. In order to access the submenu, please press the P3 button for more than 3 seconds. The “RESET ENERGY REG” indication will appear at the first line, while “YES” and “NO” will appear at the second one. In order to reset the counters, please press the P1 button; while in order to exit without resetting, please press the P5 button. And with this, we completed the description of the menus and the submenus that are displayed on the LCD screen.
A final consideration should be done, concerning the UART communication between the microcontroller and the MCP39F511 integrated circuit, for which the peripheral interrupts are used, both for the transmission and the receiving of data packets. We, therefore, arranged a 64-byte long buffer in SRAM, both for the sending and for the receiving of the packets. Moreover, there are two dedicated state machines, one for the data sending and the other one for the receiving. We would like to point out that in the data communication from and to the integrated circuit, the latter uses a communication protocol that is packed according to a well-determined structure, named as “frame”, as highlighted in Fig. 4. Each “frame” always start with a “header byte”, followed by a byte indicating the length of the frame is executed. In line after the number of bytes composing the frame there is the packet with the command (or the commands), and lastly, the checksum. The maximum number of bytes for each transmitted “frame” is 35. No command found in the “frame” is executed as long as the checksum and the number of bytes isn’t validated by the receiver.
After a “frame” has been received, the MCP39F511 integrated circuit may generate three possible replies:
Acknowledge (ACK 0x06): the “frame” has been successfully received, the command has been understood and executed;
No Acknowledge (NAK 0x15): the “frame” has been successfully received, but the command has not been understood and therefore was not executed;
Checksum fail (CSFAIL 0x51): the “frame” has been successfully received but the checksum found in the frame is a wrong one and therefore the packet was discarded.
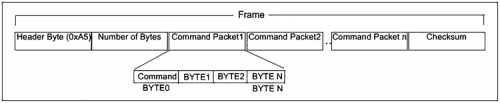
Fig. 4
The checksum is generated by adding the bytes of the “frame” (be it received or to be sent), including the “header byte”, and by dividing the result by 256. The remainder of the division is the checksum.
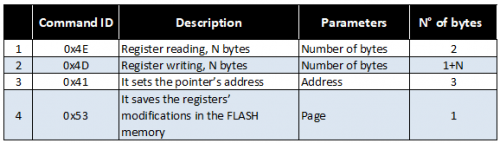
Table 1 shows the commands that are used for the management of the integrated circuit; in particular, we are interested in the commands 3 and 1, for the reading of the registers of interest. By means of the command 3 (0x41), the pointer is set in the memory, while via the command 1 (0x4E) the registers are read, in sequence, starting from the set address. The thus created “frame” contains two commands, the first one for the purpose of setting the pointer in memory, and the second one for the purpose of reading the data.
The commands 2 and 4 are needed in order to activate/deactivate the energy accumulation. However, if the power source is failing, the recorded energy values are lost anyway, since they are memorized in the integrated circuit’s SRAM.
Table1
How to connect the device
Let’s move on now to describe how the Energy Meter should be connected to the electric system. What follows is just a pair of practical examples, to give you an idea of how to connect it; we would like to point out you that the different electric connections will have to be adjusted to your electric system, according to the law in force on the subject of electrical safety and conformity of the system itself.
The first connection proposal (please see the wiring diagram in Fig. 4) considers the usage of the Finder relays of the 40.61.7.024.4001 series, to be mounted on the dedicated 95.05 sockets for DIN rails. For your convenience, we highlighted the phase wire with a black color and the neutral wire with the blue color.
Soon after the electric meter, you should place an F72N/32N isolator switch or, even better, a G8813A/32AC residual-current device. Between them, on the phase wire, the SBT002 CT by Itacoil is connected. The phase wire is a passing one, with no coil around the CT. The two low voltage contacts are directly brought to the Energy Meter and are connected to the dedicated input (please pay particular attention to the connection and do not swap the 230Vca input with the low voltage CT input, otherwise the electronics will be destroyed).
The 230Vca network voltage on the output of the isolator switch must be brought to the dedicated input of the Energy Meter. For each non-primary line, we arranged a residual-current device of the G8813A/16AC series, that sees the phase wire brought to the common input of the 95.05 sockets; the line is then resumed on the socket’s (normally open) NO contact. The line neutral is then directly drawn from the corresponding residual-current device.
We showed all the seven non-primary lines in the drawing, however, you do not have to follow this configuration: you may even decide to use two or three lines. Obviously, you will always have to start the wiring from the non-primary line 1 and all the way to line 7. The relay coils are driven by the Energy Meter and therefore – as a first thing – the jumper must be set on the position 1-2, after that, the contract signed as VEXT must be brought to each coil of the relays that have been used (that’s the red wire in the picture). The current return of each relay is brought to the contacts signed as Linea 1, Linea 2, etc.
The second proposal (Fig. 6) considers the usage – in the place of the 95.05 sockets – of some Finder relays for a DIN rail, the ones of the 22.21.9.024.4000 series. The coil voltage for these relays is still 24Vcc, but the excitement current required is greater, therefore in order to activate all the seven non primary lines, you will also have to arrange an external power supply, such as for example the 78.12.1.230.24.0.1 one, still manufactured by Finder; it is capable of supplying power up to a maximum of 12W; otherwise the onboard power source is not enough.
If you choose this solution, you will have to set the Energy Meter’s jumper to the position 2-3. The +24Vcc output of the Finder power supply must be brought both the coils of the used relays and to the VEXT contact of the Energy Meter, as shown in Fig. 5. Even in this case, it is not mandatory to use all the seven lines, therefore in the case in which the lines are at most four, it is possible to draw the coil voltage directly from the Energy Meter – as in the previous proposal – and so to avoid the usage of the 78.12.1.230.24.0.1 power supply. If you wish to follow this approach, please remember to set the jumper to the position 1-2. All the remaining connections we previously discussed remain unchanged.

Fig. 5
Calibration
The measuring boards are supplied as already calibrated. However, given the tolerance of the different components we used, as well as one of the two transformers, VT and CT, it could be needed to carry out a further calibration as for the measuring of voltage and current, so to be able to obtain the maximum possible accuracy by means of your hardware. Those who wish to execute a calibration as for the measurings of voltage and current will need:
- the EnergyMeter software (1.0.3.0 or above);
- a voltmeter as for the RMS voltage measurings;
- an ammeter as for the RMS current measurings.
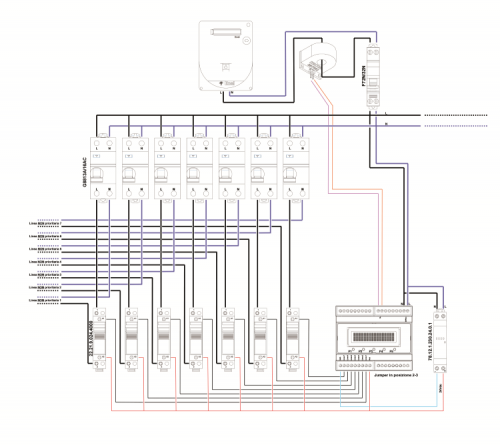
Fig. 6
The voltmeter must be connected in parallel to the general switch of your electric panel, so to measure the correct value of the 230Vca network voltage. The ammeter must be inserted in series, on the phase wire, for the current measurings, and must be placed immediately after the electric meter, so to measure all the current that has been absorbed by the electric system.
Starting from the premise that the Energy Meter is connected to the system, as described in the previous paragraph, and that therefore it is perfectly operational, you will have to recall the “PC mode” submenu. in order to do so, please press the P3 button from the “Home” menu, for more than 6 seconds; thus you will recall the “PC mode” submenu. The “PC mode enabled! Connects your PC” indication will appear on two display lines.
At this stage, it is possible to connect the PC to the FT1346 measuring board, by using the FT782M USB/Serial converter, paired with the Energy Meter software. As already explained in the article concerning the Energy Meter, after the software has been booted (Fig. 7), you will have – as a first thing – to create a communication towards the MCP39F511 integrated circuit, by acting on the “Communication Open Communication” menu entry.
Once the serial communication has been created, please verify if the measures as for voltage and current are aligned with the ones detected by your measuring tools; we would like to point out you that the Energy Meter tool has been calibrated so to have an accuracy of two decimals as for the voltage measures and three decimals as for the current measures. A difference of ±250mV and ±100mA, respectively for the voltage and the current measures, are considered as acceptable. We would like to point out that this is not a precision measuring tool but a system for the disconnection of the non-primary lines. In order to start the reading of the electrical measures, please click on the “Start Read” command; cyclically (once per second) a reading of the measuring register of the MCP39F511 integrated circuit will be executed.
Now, given the measures as for voltage and current, it will be needed to go read the parameters saved in the integrated circuit’s memory; in order to do so – and as a first thing – we will have to end the cyclical reading in progress, by clicking on the “Start Read” command; after that please click on the “Read All” command, so to read all the calibration parameters that have been previously loaded.
In order to align the voltage and current measures to your hardware/system, you will have to act on the “Gain Current RMS” and “Gain Voltage RMS” entries.
Therefore, if the voltage/current measures give values that are greater than those displayed by your tools, you will have to decrease the values in the two registers; vice versa you will have to increase them.
For each modification – and in order to make it effective – you will have to click on the “Write Calibration Registers” command, but only after having ticked the two entries, otherwise the data won’t be transferred.

Fig. 7
Once the programming has been executed, you will have to verify its effectiveness, by starting a reading cycle and by comparing the new measures with the ones shown by your tools, for the purpose of verification. If you are not satisfied, you will have to repeat all the described steps. All the other operational parameters must no be modified by means of a complete recalibration of the integrated circuit; however, in the case you encountered some problems, you might want to rely on the configuration file that is distributed with the Energy Meter software and to program the MCP39F511 integrated circuit again. Once the calibration has been completed, please remember to free the PC’s virtual COM port, to disconnect the USB/Serial converter and to exit the “PC mode”, by pressing the P3 button found on the tool’s panel.
For those who possess a wattmeter as a measuring tool (for example, a WT210/230 one, by Yokogawa, or similar ones), that is capable of displaying the values of the real power – in addition to the ones for voltage and current – , we would like to point out that it is possible to try a fine calibration of the real power, by acting on the “Gain Active Power” parameter.
Conclusions
We may consider the discussion of this project as complete since it shows the first practical application of the MCP39F511 integrated circuit. Certainly, we will propose more possible applications in the future, and will also bring all of them on systems that are based on Raspberry Pi and Arduino. There are several possibilities offered by this integrated circuit, and they are especially in the field of the monitoring of the electric energy consumption; such applications make the user aware of the efficiency of his electric system, and of the consumption associated. Thus they bring the possibility to increase its efficiency and to significantly decrease in the costs.
From openstore
CURRENT MEASUREMENT TRANSFORMER
VOLTAGE MEASUREMENT TRANSFORMER
