- Building a 3D Digital Clock with ArduinoPosted 4 months ago
- Creating a controller for Minecraft with realistic body movements using ArduinoPosted 5 months ago
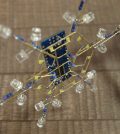
- Snowflake with ArduinoPosted 5 months ago
- Holographic Christmas TreePosted 5 months ago
- Segstick: Build Your Own Self-Balancing Vehicle in Just 2 Days with ArduinoPosted 6 months ago
- ZSWatch: An Open-Source Smartwatch Project Based on the Zephyr Operating SystemPosted 7 months ago
- What is IoT and which devices to usePosted 7 months ago
- Maker Faire Rome Unveils Thrilling “Padel Smash Future” Pavilion for Sports EnthusiastsPosted 7 months ago
- Make your curtains smartPosted 7 months ago
- Configuring an ESP8266 for Battery PowerPosted 8 months ago
A PC and an Arduino: here’s your DIY Oscilloscope
Web site:
http://www.avrfreaks.net/index.php?module=Freaks%20Academy&func=viewItem&item_type=project&item_id=3888Project Summary:
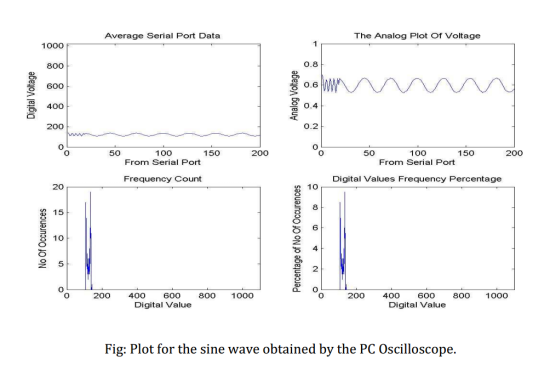
We have designed an Oscilloscope using PC and Arduino Board. The signal is first of all fed to the Arduino Board where the analog signal is converted to a digital signal by the ADC which is then serially outputted to the PC and is read by the MATLAB software via the COM ports. Here the signal is read in the form of digital data but then is converted to analog one by using the resolution of the ADC used by the Arduino Board. The MATLAB software was then used to plot the signals.
Full Project:
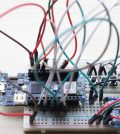
The input to be plotted is given to one of the five analog pins in the board. The software used for interfacing the board with the PC is Matlab R2012a. The compiler Arduino 1.0 has been used for uploading the codes to the board. The MAX 232 Line Driver and ATmega328 Processor has been used. The various components used in this designing has been illustrated briefly in the coming sections.
Full project in PDF: DESIGNING A PC OSCILLOSCOPE
Circuit diagram:
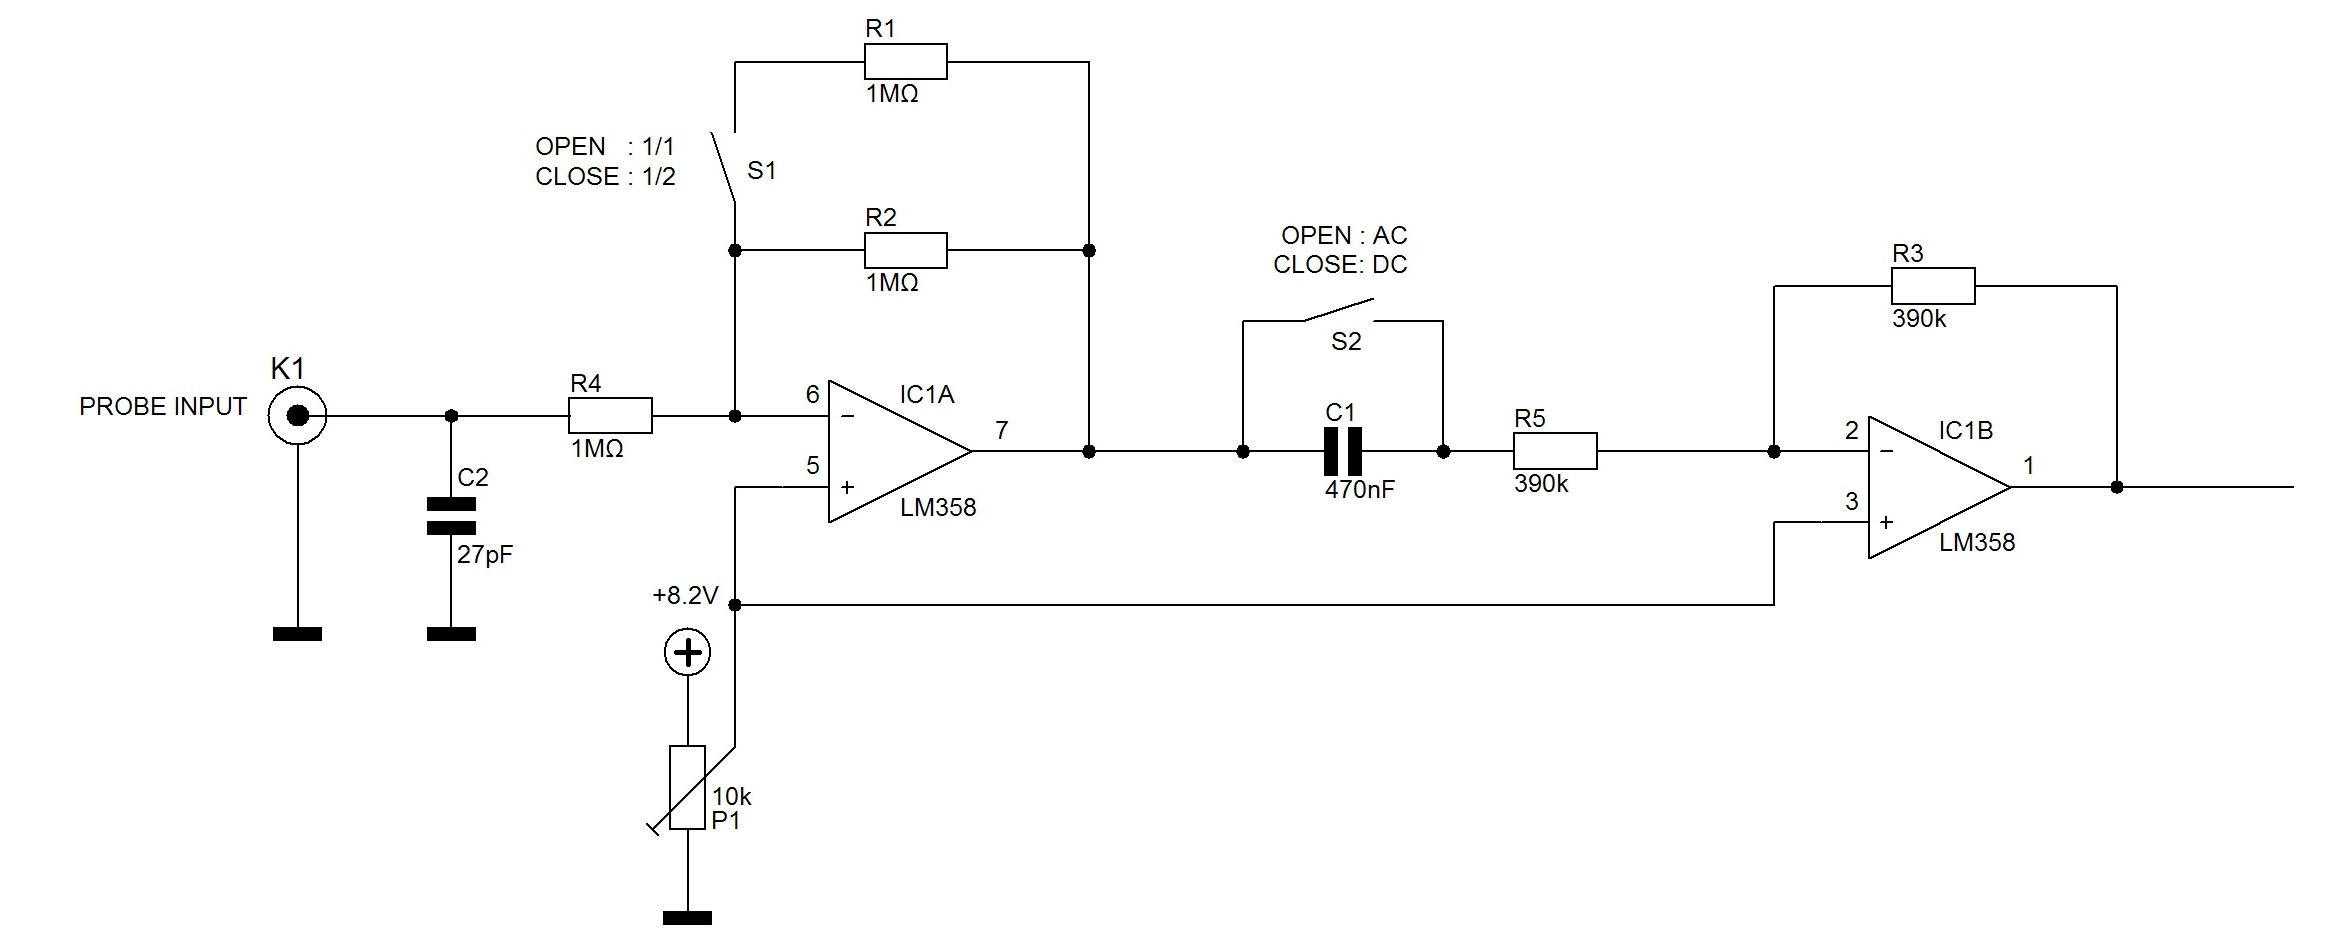
Bill of Materials:
Arduino Board
LM358 IC
RESISTORS:
3PCS 1Mohm
CAPACITORS:
2PCS 0.01 µF
Firmware:
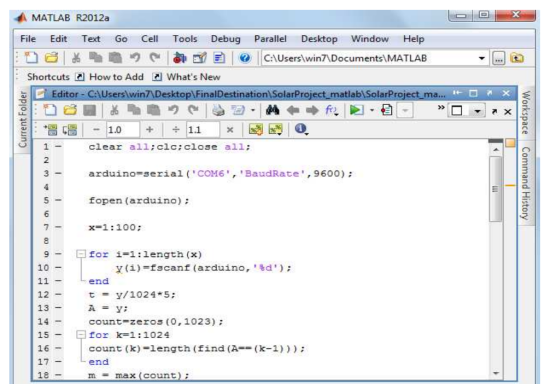
MATLAB CODE FOR SERIAL INPUTTING AND PLOTTING OF WAVEFORM
clear all;clc;close all;

arduino=serial('COM6','BaudRate',9600);

fopen(arduino);

x=1:100;

for i=1:length(x)
    y(i)=fscanf(arduino,'%d');
end
t = y/1024*5;
A = y;
count=zeros(0,1023);
for k=1:1024
count(k)=length(find(A==(k-1)));
end
m = max(count);
in = find(count==m);

fclose(arduino);

disp('making plot..')
figure('Name','The Digital Values From Serial Port');
subplot(2,2,1)
plot(x,y);
title('Serial Port Data');
ylim([0 1023]);
xlabel('From Serial Port');
ylabel('Digital Voltage');


subplot(2,2,2)
plot(x,t);
title('The Analog Plot Of Voltage');
ylim([0 5]);
xlabel('From Serial Port');
ylabel('Analog Voltage');

fprintf('%d is found toh be maximum count of %d ',in-1,m);

subplot(2,2,3)
t = 0:1023;
plot(t,count),title('Frequency Count');
xlabel('Digital Value');
ylabel('No Of Occurences');
xlim([0 1023]);

subplot(2,2,4)
d = count/length(A)*100;
plot(t,d);
title('Digital Values Frequency Percentage');
xlabel('Digital Value');
ylabel('Percentage of No Of Occurences');
xlim([0 1023]);

 Arduino Board codes

void setup() {
  // initialize serial communication at 9600 bits per second:
  Serial.begin(9600);
}

// the loop routine runs over and over again forever:
void loop() {
  // read the input on analog pin 0:
  int sensorValue = analogRead(A0);
  // print out the value you read:
  Serial.println(sensorValue);
  delay(100);        // delay in between reads for stability
}
Software & Code Snippets:

20 Comments
Leave a Reply
-
 Arduino ISP (In System Programming) and stand-alone circuits
We use an Arduino to program other ATmega without...
- Posted 12 years ago
-
-
-
 GSM GPS shield for Arduino
Shield for Arduino designed and based on the module...
- Posted 12 years ago
-
 Small Breakout for SIM900 GSM Module
Some post ago we presented a PCB to mount...
- Posted 13 years ago
-
 Join Maker Faire Rome 2024: Innovation Unleashed at Gazometro Ostiense | Calls Now Open!
All Calls Now Open for Maker Faire Rome 2024...
- Posted 1 week ago
-
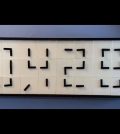 Building a 3D Digital Clock with Arduino
Project to create a digital clock consisting...
- Posted 4 months ago
-
 Acoustic amplifier – in DIY Kit
This kit creates a microphone amplifier with an output...
- Posted 5 months ago
-
 Creating a controller for Minecraft with realistic body movements using Arduino
Project of a controller that maps body movements...
- Posted 5 months ago
-
Pingback: Merry Christmas and a Open New Year | Open Electronics