
Let’s learn about an interesting educational platform that allows you to make and study a real multitude of electronic circuits and their applications.
Among the techniques to approach students and very young people, the one of using ecosystems related to prototyping boards such as Arduino has proved to be very effective; next to it and, we can say, in synergy with it, a series of mini-labs and experiment kits have developed. Among these, it seems interesting to point out Totem Mini Lab, which is a small but powerful portable and benchtop electronics lab to experiment and learn the basics of electronics.
Fully compatible with the Arduino programming environment, since it is based on an Arduino-like board, Totem Mini Lab includes a variety of measurement tools and electronic blocks ready to use for experiments.
Designed to be used in conjunction with the Totem building system, it allows you to build compact workbenches with integrated breadboards, saving you from flying connections. It is also compatible with I/O, sensor and audio expansion boards, which can further expand capabilities.
The use of Totem Mini Lab is simple and attractive, also because it will no longer be necessary to worry about making wiring, often messy, precarious connections, etc.. for example when with jumpers you wire the various breakout boards with Arduino: here we are faced with a frame that houses, already interconnected, the necessary boards and that groups all the basic electronics of the laboratory.
WHAT IT IS COMPOSED OF
The core of the electronics is a special version of Arduino UNO called TotemDuino and specially developed. Let’s see what elements make up the Totem experiment kit, starting from what’s in the box:
- TotemDuino;
- LabBoard, which is an experimentation and measurement platform;
- 34-pin flat-cable to interconnect TotemDuino and LabBoard;
- frame to be assembled for the construction of Totem workbenches;
- mains power supply (220 Vac / 12 Vdc 1.5 A) to power your laboratory;
- 2 breadboards with 700 contacts to connect external components and circuits in order to expand the experimentation area when the elements on the frame are not enough;
- 40 male-male jumpers about 20 cm long + Set of 140 jumper cables for making connections on the experimental bases;
- 1-meter long USB-mini USB 2.0 cable to connect TotemDuino to the Personal Computer.
Complete with a richly illustrated technical manual in English, explaining how to get started and the use of Totem parts to build a workbench.
MAINBOARD
Let’s now spend a few lines going deeper into the main board of Totem MiniLab, shown in Fig. 1.
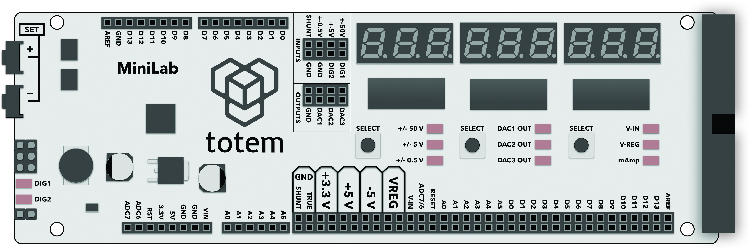
Fig. 1
This board incorporates a number of peripherals and interfaces and can have a dual-use.
It can be used both as an expansion board for the TotemDuino system (since it provides easily accessible input and output connections) and as a measurement and test unit.
The card contains the following modules:
- section compatible with Arduino Shields;
available output voltages:
- 12 V/1 A – direct supply voltage
- 5 V/0,5 A – regulated supply voltage, shared with TotemDuino.
- 3,3V/0,25 A – regulated supply voltage, shared with TotemDuino and LabBoard processor;
- -5V/0,5A – Separate regulated voltage, for experimentation with amplifiers;
- programmable voltage output from 0 to 3.3 V, up to 0.35A;
- digital/analog converter;
- voltage measurement:
– ± 0.5 V to be used when measuring small amplitude signals;
– ± 5V to measure signals with TTL logic level;
– ± 50 V for measuring external signals;
- current measurement up to 800 mA;
- frequency meter with signal measurement capability up to 1 MHz;
- pulse counter up to 999.999.999;
- arbitrary pulse generator, capable of generating a series of pulses with programmable width and period.
TotemDuino
Fully compatible with Arduino UNO, the board that is the brain of the TotemDuino platform has the following functionalities:
- I / O protection; all the output pins that enter the LabBoard are protected against overvoltage or short circuits;
- 34-pin expansion connector for flat cable that allows you to connect TotemDuino to the LabBoard, facilitating access to the pins;
- 5V voltage regulator to supply relatively high power loads;
- microcontroller logic voltage selectable between 5 V and 3.3 V.
The board is therefore a board with an Arduino UNO core but equipped with connections and hardware configuration optimized for the Totem environment. The layout of the board components is shown in Fig. 2.
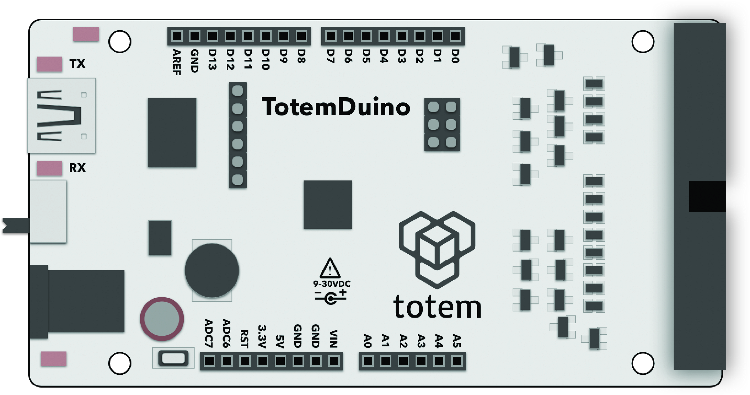
Fig. 2
MINILAB FRAME
One feature of the Totem platform is that it is based on a frame that groups the electronics, so experimentation becomes easy and doesn’t involve having the bench littered with electronic boards in disarray; everything is organized on a three-dimensional frame that makes it easy to see and connect all the elements on board. This structure makes it easy to upgrade and expand: just add the mechanical or electronic parts required by the application.
It also includes all the mechanical elements needed to assemble the frame.
The structure based on the frame is so compact that, if needed, it is possible to move the circuit realized from the laboratory bench directly on the field, for example, to test in practice a simulated application; all in one body, without having to get help to move and to support boards, wires and any other “flying” elements.
This characteristic of the Totem system, which you will discover by using it, is particularly appreciable and makes a difference with competing solutions.

Fig. 3
SIDE PANELS EXPANSION
The Totem MiniLab system includes a series of optional side panels that contain separate, ready-to-use electronic modules such as displays, sensors, switches and anything else that may need to be added to perform particular experiments.
Fig. 4 shows the MiniLab Totem equipped with what they call “Side Panels” and a breakout board attached to the frame and ready for interconnection. The Side Panels contain components and modules that are often used when testing an embedded project.
This allows you to solve many problems typical of experimental circuits that require many elements.
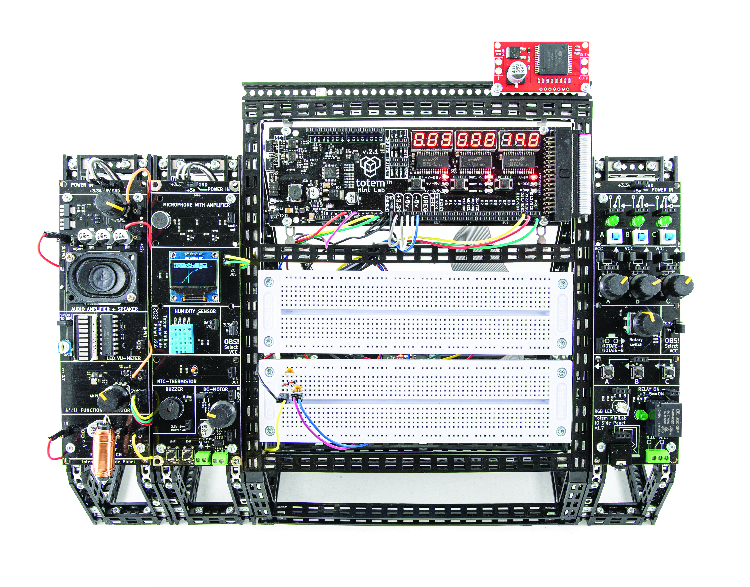
Fig. 4
Another problem when building prototypes, or just wanting to test a code for a project, is connecting certain electronic components to the Arduino because sometimes it is difficult to do and can cause connection errors and sometimes damage from them since many components do not fit well on a breadboard and must be connected flying. The beauty of Totem is that it already has many components on board (Fig. 5) to be interconnected for the realization of experiments and that its structure simplifies the addition of external elements.
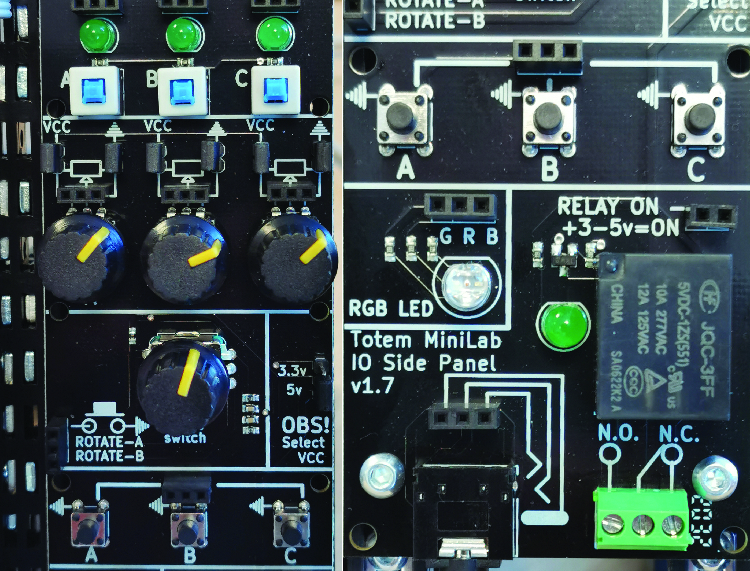
Fig. 5
The Side Panels have blocks that accomplish several frequently used functions: there are audio circuits, function generators, and BF amplifiers with speakers.
The other side panels have input devices such as potentiometers and switches, relay drivers and DC motor drivers. There are also LED drivers and an OLED display for use in more complex designs when values and indications need to be displayed.

Fig. 6
USING THE FUNCTION GENERATOR
After having introduced the Totem MiniLab platform, to give you an idea of what you can do with it, we propose the realization of an exercise that better than any words exposes and explains the potential of the system: we are going to use the on-board function generator based on the integrated AD9833, which allows you to generate sine, triangle and square/rectangular waveforms.
The frequency generator is controlled by the Arduino board via three I/O pins, which is the SPI interface in the ARDUINO (Serial Programming Interface) code. We’ll use the included audio amplifier to get more amplitude from the frequency generator and we’ll set the volume pot to maximum, again to maximize the available amplitude.
Note that you can listen to the signal by inserting a jumper on the contacts (headers) labelled “SP ON” that is located just above the speaker on the right.
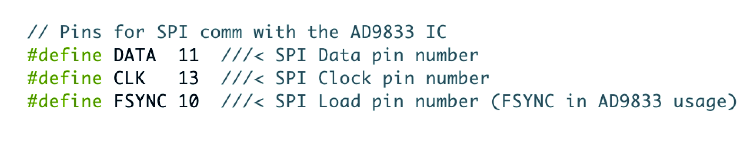
Fig. 7
TEST THE CUT-OFF FREQUENCY OF A HIGH-PASS FILTER
The experiment we will show here will use the function generator to produce a sinusoidal signal that will be sent to a simple high-pass LC filter. Since we will be measuring standing waves only, it is not necessary to match the output impedance of the generator and the input impedance of the filter; it will not be, instead, possible to use such a filter for transient signals, but here it is not a problem because we are simply interested in finding the cutoff frequency. Fig. 8 shows the schematic of the filter and the location of its components on the corresponding Side Panel.
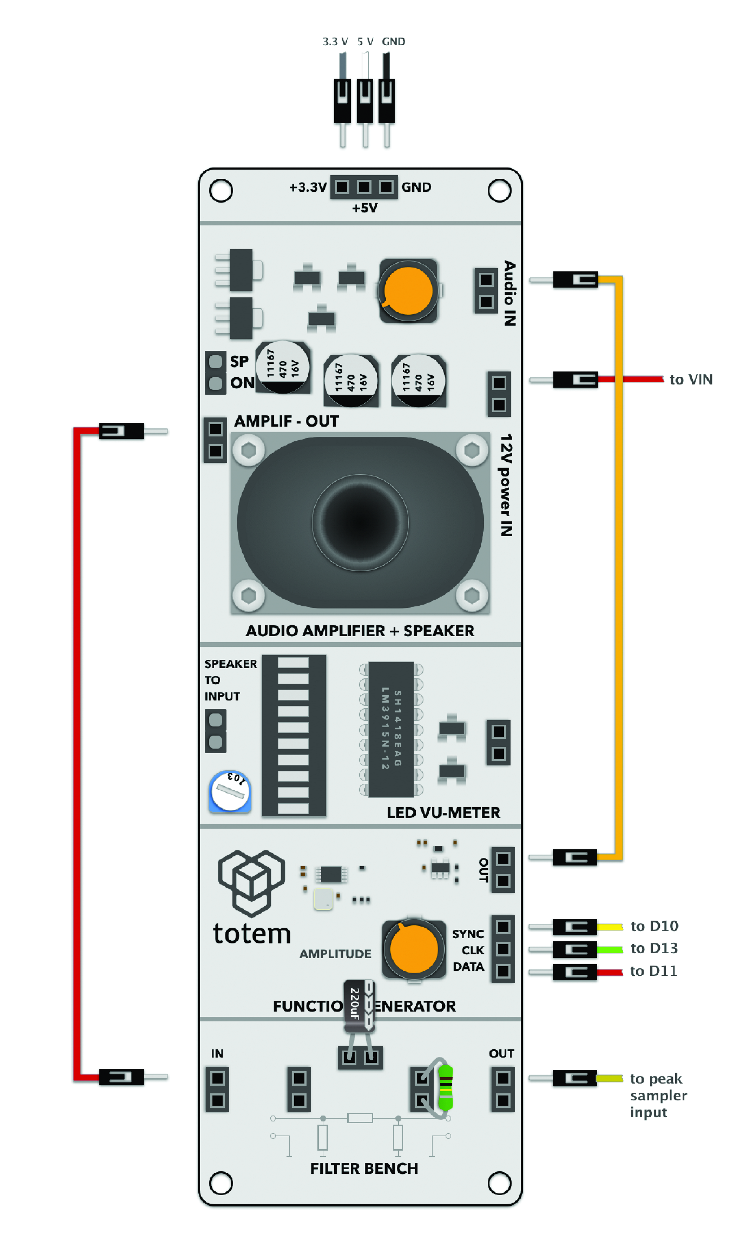
Fig. 8
When measuring sinusoidal waveforms, the best thing to do is to rectify the waveform and create a unidirectional, quasi-continuous voltage, which the Arduino ADC can accurately measure.
For this purpose, at the output of the filter, we connect a small circuit called a peak detector, together with a blocking diode. The blocking diode (it is a Schottky connected in such a way as to cut off the negative half-waves) ensures that the signal downstream of the circuit, i.e. at its ends, is all positive (above zero volts). The peak detector circuit returns on the cathode of the second Schottky (the one in series with the capacitor) a no-load voltage that ideally is equal to the peak voltage of the sine wave (in reality it is equal to the peak minus the minimum direct drop on the Schottky diode), which allows obtaining a continuous component proportional to the amplitude of the sine wave signal coming out of the high-pass filter (Fig. 9). Knowing the amplitude of the input signal we can deduce the cut-off frequency because it is the one at which the ratio between the output voltage and the input voltage is 0.5 or -6dB (remember that this is a second-order filter). The cut-off frequency of our filter is given by the formula:
fc= 1 / (2*π*√LC )
and the values predicted by the experiment, shown in the electrical diagram of the filter in Fig. 8 are theoretically 340 Hz. It should be noted, however, that it can differ depending on the tolerance of the components, as we will see by analyzing the results of the experiment conducted.
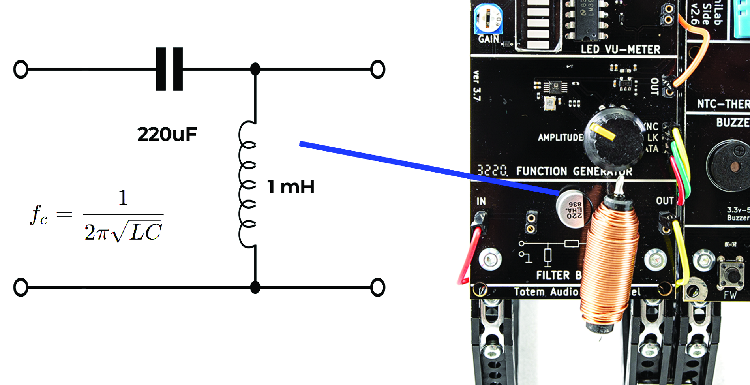
Fig. 9
THE ARDUINO SKETCH
So let’s look at the firmware to be loaded into Arduino, which automatically performs the cut-off frequency measurement test in the complete circuit implemented on the platform as shown in Fig. 10. To perform the task, the sketch uses some libraries for the functions of the electronics available on the side panel, such as SPI.h for 3-wire serial communication with the AD9833 frequency generator and Wire.h for I²C serial communication. The firmware also includes the MD_AD9833.h library for managing the AD9833 function generator chip and provides for the management of the 128×64 pixel OLED display using the Adafruit specific libraries: Adafruit_SSD1306.h and Adafruit_GFX.h for drawing and writing to the display.

Fig. 10
In our design, the results of the frequency scan and then sweep are displayed on an OLED display on Side Panel 2 in the form of a frequency response curve (Fig. 11). Each measurement is stored in a data array and plotted as a pixel on the display. Then the cutoff frequency is calculated and written down. The display is controlled by the Arduino via the I²C bus. The TotemDuino uses the Wire.h library for communication over the I²C bus via the A4 (SDA) and A5 (SCL) I/O pins.

Fig. 11
The code, shown in full in the screenshots how easy it is to use the different modules in the Side Panels, and most of the code deals with the frequency sweep, measurements, and result display.
The sweep is used to send a wide enough frequency spectrum to the input of the filter that the amplitude trend can then be checked at the output, i.e. on the filter capacitor under test.
Listing
// Basic MD_AD9833 test file
//
// Initialises the device to default conditions
//
#include <SPI.h>
#include <Wire.h>
#include <MD_AD9833.h>
#include <Adafruit_GFX.h>
#include <Adafruit_SSD1306.h>
//Define screen size in pixel
#define SCREEN_WIDTH 128 // OLED display width
#define SCREEN_HEIGHT 64 // OLED display height
// Declaration for an SSD1306 display
#define OLED_RESET -1
// Reset pin # (or -1 if sharing Arduino reset pin)
//Initialize display
Adafruit_SSD1306 display (SCREEN_WIDTH,
SCREEN_HEIGHT, &Wire, OLED_RESET);
// Pins for SPI comm with the AD9833 IC
#define DATA 11 ///< SPI Data pin number
#define CLK 13 ///< SPI Clock pin number
#define FSYNC 10 ///< SPI Load pin number
#define SAMPLES 64
MD_AD9833 AD(FSYNC); // Hardware SPI
int freq;
int buffer[SAMPLES];
void setup(void)
{
Serial.begin(57600);
display.begin(SSD1306_SWITCHCAPVCC, 0x3C);
display.display();
display.clearDisplay();
AD.begin();
freq = 100;
AD.setMode(MD_AD9833::MODE_SINE);
}
void graphSpectrum(void)
{
int i;
display.clearDisplay();
for(i=0;i<SAMPLES;i++)
{
int value = buffer[i] / 4;
display.drawLine(i*2, 63-value, (i*2)+1,
63-value, SSD1306_WHITE);
}
}
int minfreq;
int maxfreq;
int stepF;
void frequencySweep(int minf, int maxf, int steps)
{
minfreq = minf;
maxfreq = maxf;
stepF = (maxf - minf) / steps;
AD.setMode(MD_AD9833::MODE_OFF);
delay(150);
AD.setMode(MD_AD9833::MODE_SINE);
int f = minf;
for(int i=0;i<steps;i++){
AD.setFrequency(MD_AD9833::CHAN_0, f);
f += stepF;
delay(50);
buffer[i] = analogRead(A0)/4;
}
}
void calculateFreq()
{
//search for min and max
int minv=255,maxv=0;
int mini=0,maxi=0;
for(int i=0;i<SAMPLES;i++)
{
if(minv>buffer[i])
{
minv = buffer[i];
mini = i;
}
if(maxv<buffer[i])
{
maxv = buffer[i];
maxi = i;
}
}
int f = 0;
for(int i=0;i<SAMPLES;i++)
{
//find the value that goes -3dB from max:
if(buffer[i]> (maxv/2))
{
f = i;
break;
}
}
//Print on serial
Serial.print(“max:”);
Serial.print(maxv);
Serial.print(“ “);
Serial.print(buffer[f]);
Serial.print(“ “);
Serial.println(f);
//Print on display
display.drawLine(f*2, 0, (f*2),
display.height(), SSD1306_WHITE);
char message[16];
sprintf(message,”fc:%d Hz”, minfreq + (stepF*f));
display.setTextSize(2);
display.setTextColor(SSD1306_BLACK,
SSD1306_WHITE);
display.setCursor(0, 0);
display.print(message);
}
//loop routine
void loop(void)
{
//collect samples
frequencySweep(20, 1000, SAMPLES);
//update screen
graphSpectrum();
//calculate limit freq
calculateFreq();
display.display();
}
CONCLUSIONS
The experiment we just conducted shows that with simple methods, Arduino or at least an Arduino-like board like the TotemDuino can be used for automated measurements in essential electrical and electronic circuits.
The LC filter we used in this setup was a demonstration of how measurements can be made, obtaining numerical and even graphical results, thanks to the ability to use the small OLED display as data output. The exercise can be a basis to expand, for example by sending the results to a PC for a better screen to show the graphs.
FROM OPENSTORE
