While the Arduino IDE provides a simple and clear interface that is ideal for novice users, the more advanced users often report that the editing capabilities are a bit limited compared to modern editors. This includes features like code indentation, block folding, auto-closing brackets, regular expression search and replace, comment toggling. In addition to this, many users have been asking for live debugging, i.e. the ability to run code on an attached board and stop it at a given line to check the contents of variables, memory and registers.
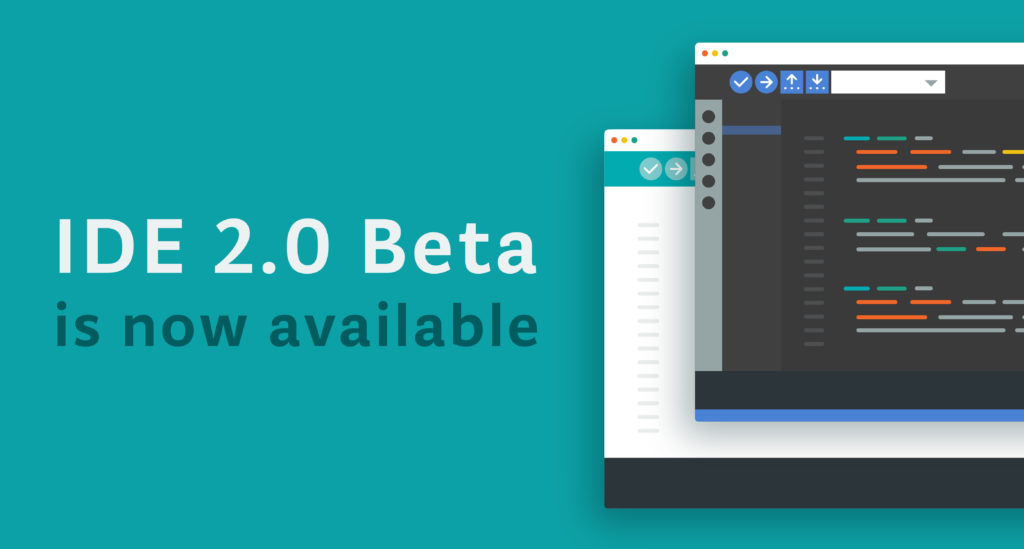
The time has come: please welcome the Arduino IDE 2.0 (beta)
The Arduino IDE 2.0 beta is available for download and its code repositories become open source. It carries a modern editor and provides a better overall user experience thanks to a responsive interface and faster compilation time.
Features
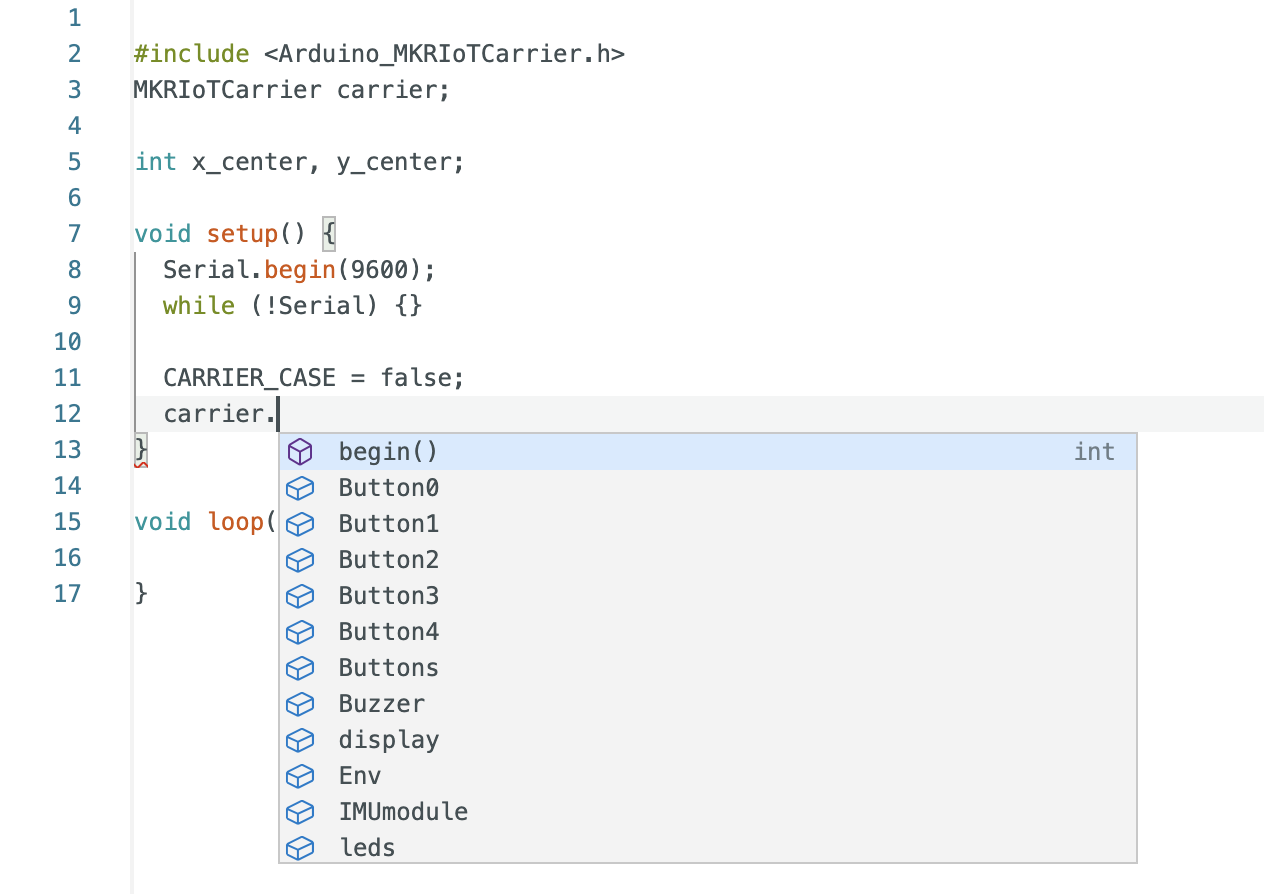
While typing, the editor suggests the autocompletion of variables and functions according to the libraries you included:
when right-clicking on a variable or a function, a contextual menu will provide navigation shortcuts to jump to the line (and file) where they are declared.
See this page to learn more about the new editing tools.

But there’s another big feature in the new IDE: a live debugger that allows you to run your code interactively on a board and inspect its execution without writing tens of “Serial.println()” statements. Just fire the debug panel, set breakpoints where you want to pause the execution and inspect the content of variables. Oh, you can even change the content of variables on the fly and resume execution!
As of today, the debugger supports all the Arduino boards based on the SAMD and Mbed platforms (MKR family, Nano 33 IoT, Nano 33 BLE, Portenta, Zero). Maintainers of Arduino cores for third-party boards can add support for debugging by adding the relevant configuration parameters. You’ll need to connect a debugging probe such as the Segger J-link to the JTAG pins on the board and you’ll be ready to go.
The new IDE is based on the Eclipse Theia framework, which is an open-source project based on the same architecture as VS Code (language server protocol, extensions, debugger). The front-end is written in TypeScript, while most of the backend is written in Golang.
Try it now!
So do not hesitate to download it now and join the discussion in the forum! Ready to get started? Follow along with tutorials here.
