- makeITcircular 2024 content launched – Part of Maker Faire Rome 2024Posted 2 weeks ago
- Application For Maker Faire Rome 2024: Deadline June 20thPosted 2 months ago
- Building a 3D Digital Clock with ArduinoPosted 7 months ago
- Creating a controller for Minecraft with realistic body movements using ArduinoPosted 7 months ago
- Snowflake with ArduinoPosted 8 months ago
- Holographic Christmas TreePosted 8 months ago
- Segstick: Build Your Own Self-Balancing Vehicle in Just 2 Days with ArduinoPosted 8 months ago
- ZSWatch: An Open-Source Smartwatch Project Based on the Zephyr Operating SystemPosted 9 months ago
- What is IoT and which devices to usePosted 9 months ago
- Maker Faire Rome Unveils Thrilling “Padel Smash Future” Pavilion for Sports EnthusiastsPosted 10 months ago
ArduGraph
Project Summary:
ArduGraph is open-source easy to use serial graph monitor for Arduino.
Full Project:

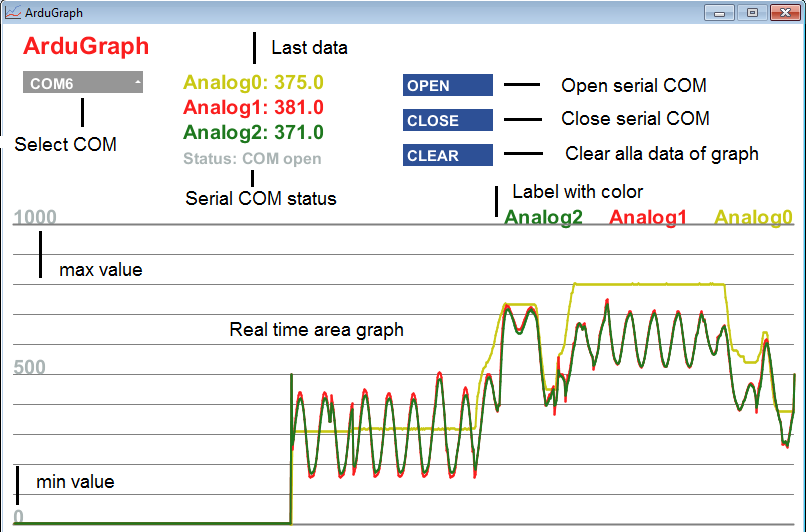
ArduGraph is a simple PC software, created with Processing, can plot data received from the serial port. It is perfect for projects where you need to display different data variables over time varying analog signals or sensor measure.
its features are:
Plot real-time data from Arduino
Configurable with Arduino sketch
Easy to use
No need for installation
Up to three graphs simultaneously
Graph data types byte, int and float
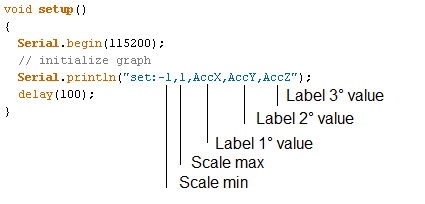
ArduGraph is easy to configure, only you need to specify the minimum and maximum to plot data and the label of the trace. The string to be send contains a value of minimum scale to plot (positive or negative), a value of maximum scale to plot (positive o negative) and three label of trace to plot; each value is separated by a comma. The parameters are easy to set with one line of Arduino code.
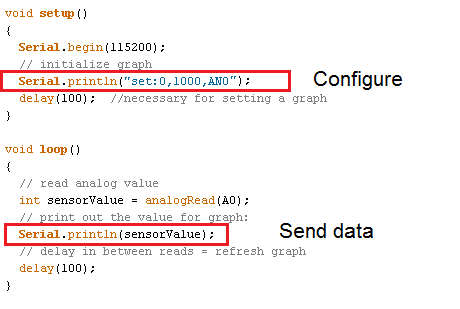
ArduGraph draws one, two or three tracks automatically depending on how many data arrive. The number off trace depending from number of data are transimit, and time to plot dependig from velocity are transmit the data. Every time it receives a given this is plotted, faster data arrives faster evolve graph. The data to be sent are semply a string in the same way of Serial Monitor of Arduino.

Simple to use to display the data reads by a sensors.

When using ArduGraph simultaneously with Arduino can close COM to program Arduino and then reopen it; only one istance of COM can open. When ArduGraph start, the Arduino board is reset and receive the set of command for setting the graph and it is ready to plot.
ArduGraph is written with Processing2 and you can create an executable file (for Windows, Linux and Mac platforms) simply by using the Export Application functionality of the File menu.
ArduGraph Source code and examples

-
 Arduino ISP (In System Programming) and stand-alone circuits
We use an Arduino to program other ATmega without...
- Posted 12 years ago
-
-
-
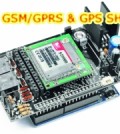 GSM GPS shield for Arduino
Shield for Arduino designed and based on the module...
- Posted 12 years ago
-
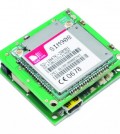
 Small Breakout for SIM900 GSM Module
Some post ago we presented a PCB to mount...
- Posted 13 years ago
-
 makeITcircular 2024 content launched – Part of Maker Faire Rome 2024
Applications to MakeITcircular must be in by October 3,...
- Posted 2 weeks ago
-
 SONY color camera module, 700 TV Lines
Color camera module equipped with a 1/3″ CCD sensor...
- Posted 3 weeks ago
-
 ESP32 Low Power Module
ESP32 Low Power Module, based on Espressif’s SoC capable...
- Posted 2 months ago
-

-
 Application For Maker Faire Rome 2024: Deadline June 20th
Learn More About the Ideas, Makers + Projects at...
- Posted 2 months ago
2 Comments