
Let’s build the Dashboard to optimally manage our network of IoT Antennino devices connected through the dedicated Gateway module.
After having described the hardware gateway for the Antennino modules and having combined it with a Dashboard based on the ThingsBoard software ideally, with which to govern a network for the IoT, in this article we will get to the heart of Antennino Gateway management by creating a custom Dashboard. Once again, we will go through ThingsBoard, which we will use to build the Dashboard step by step to manage the telemetry data coming from the Antennino sensor nodes. We will then display temperature, brightness, battery voltage, the signal level on analog Widgets and graphs. We will also explain how to control, via ThingsBoard, an LED on the Antennino modules using what is indicated by the acronym RPC (Remote Procedure Call). We will make test dashboards, and we will also see how to speed them up by taking a more professional approach. We will also explain how to implement the backup of our Dashboard configurations.
Let’s configure the antennino’s gateway
If we are using the live version of ThingsBoard we will need to authenticate on the following URL:
https://demo.thingsboard.io/login by entering the credentials we provided during registration. Otherwise, we will need access to our private ThingsBoard server on port 8080, which can be reached at https://xxx.xxx.xxx.xxx:8080.
So, let’s see how to add our Antennino Gateway to the configuration.
Go to the Devices menu item (Fig. 1), locate the orange button with the + symbol in the lower right corner of the panel, and add a device named “Gateway Antennino.” The important thing is to check the option: “It’s a Gateway.”

Fig. 1
We can keep the other existent devices, they could be useful for us to experiment with the tutorials provided by the ThingsBoard site. Once you have inserted the Gateway, reopen the list of devices and double-click on the one in the list just inserted, then click on “Copy Access Token.” This allows you to save the access key of the Gateway device in your notebook. An example value could be: eOlO3RjnhSBs6rrzkSOx. This Token must be used later in the configuration of our Gateway to authenticate on ThingsBoard; please note that this is confidential and should not be disclosed at all. The next step is to assign the Antennino Gateway device to the user “Customer A.” To do this, select from the menu on the left the item “Clients” and once you have found the Client concerned to click on “Manage client devices” (see Fig. 2) a new window will open that will list the devices present, click on the bottom right button with the + sign and select from the list the device “Gateway Antennino” then click on “Assign.”
This operation is essential because it makes you sure that all RFM69 devices, that will be “intercepted” by the Gateway, will not only loaded in the devices visible on ThingsBoard, but automatically assigned to Customer A, because Customer A is assignee of the Antennino Gateway (Fig. 2). If the customer list is empty, simply click on the orange button at the bottom right and add the missing customer.
At this point, we close any open browsers completely, then feed the Antennino Gateway while holding down the button (P1) to reset the WiFi configuration on board. Let’s wait 30÷40 seconds and check if, in the list of Wi-Fi networks listed on our PC, there is a network that has the following SSID: TB-AntenninoGateway.

Fig. 2
If yes, we can proceed. Otherwise, we try to cut the power to the Gateway, wait 10 seconds to reconnect the power and check the presence of the Gateway AccessPoint signal again.
In the configuration phase, our Gateway acts as an Access Point. Double-click on the TB-AntenninoGateway (as if we were connecting to a real WiFi network), and after a few seconds, the page in Fig. 3 will open in the Browser.
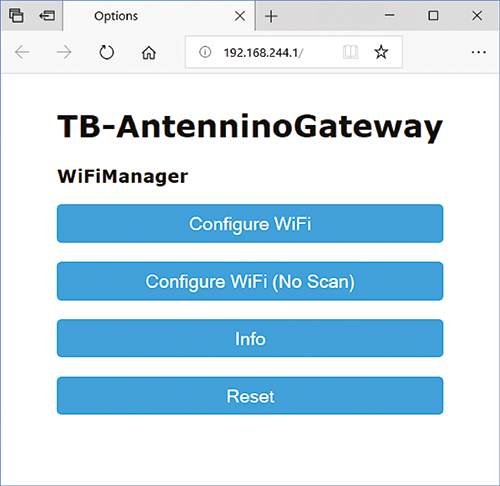
Fig. 3
Click on the “Configure WiFi” button. The Gateway configuration page will open (Fig. 4). First, we need to select the WiFi network to which our Gateway will connect to acquire Internet connectivity. We click on the Name of the network we want to connect to, enter its password and then we need to enter the IP address of the ThingsBoard server on which we will host our Dashboard and the access “TB Token” that we copied previously when setting up the Gateway on ThingsBoard. If the Live Demo server http://demo.thingsboard.io is used, its IP = 104.196.24.70.
So, we could use this address, but it’s better to leave the field “mqtt server” empty and enhance “mqtt server name” with “demo.thingsboard.io”; then, our Gateway will resolve the value in an IP address. In this case, the username field with the login token must be filled in, and the password must be left blank.
The value of the “MQTT port” parameter must be 1883 (canonical value of the port of an Mqtt Broker). The “timezonedb_key” field relating to the TimeZonedB service must also be used to synchronize the RTC onboard the board. We remind you that to use the synchronization service, you must register on the site: https://timezonedb.com. Once registered, go to Account Overview and copy your Key API Once the configuration is complete, we can click on “Save.” The page will be replaced with a page that will confirm the correct saving of the data. If everything has worked properly, our Gateway should have acquired the configuration and saved it on the SPIFFS Filesystem inside the ESP32 module. At the next restart, it will use this configuration to acquire Internet access and access data to our ThingsBoard server. Let’s go now to check if the Antennino devices are displayed.
Then open the “Devices” item from the left menu. After a few minutes, we should find new devices on the list: RFM69_1 and RFM69_2 … RFM69_XX.
For further confirmation let’s see which devices are attributed to our Customer A. To do this we go back to the customer list and, found the “Customer A,” we go to inspect “Manage Customer Devices“: we should find the list of RFM69 devices associated with Customer A.
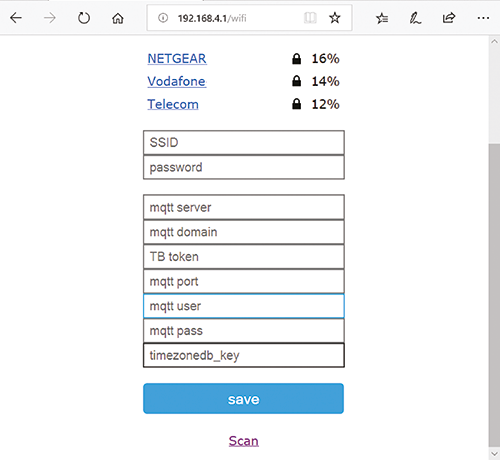
Fig. 4
Let’s make the first Dashboard
Now that we have our two RFM69 devices present on ThingsBoard let’s go to view the telemetry data sent by the devices themselves; for this purpose, we double click on one of the two RFM69 devices and then open the Tab (Fig. 5) with the words “LAST TELEMETRY.” If we keep this Tab open and leave the devices and the Gateway powered, we will see the telemetry data values change with a refresh rate of about 5 seconds.

Fig. 5
Well, now that we have the data, what do we do with it? The answers to this question are many, so let’s limit ourselves to the primary data: for example, we can view the data received from our devices in different ways, using what are referred to as Widgets, to be placed on a specific Dashboard.
Let’s see the most immediate way to do it: let’s select, for example, the checkbox relative to the telemetric data Brightness (L); as soon as it is selected the message “SHOW ON WIDGET” appears (Fig. 6) by clicking on which we can select a specific family of Widgets (Fig. 7); let’s then select the “Analog Widget” typology and then browse the available ones, dwelling on the one visible in Fig. 8. Now click on the “ADD TO DASHBOARD” button, enter any options, and click on “ADD.” By opening the newly created Dashboard we will see the final result.

Fig. 6

Fig. 7

Fig. 8
If we change the lighting condition of the LDR sensor on the RFM69_1, we will see that the analog indicator will adjust.
Well, we made our first Dashboard! Other Widgets can be added to it, Widgets that display data from other devices or telemetry data related to the same device; to do this, simply click on the orange button with a pencil icon at the bottom right. With this action, we will have the ability to edit the Dashboard, delete the current Widget, add more, or edit individual Widgets. For example, you can edit the Widget to change its caption, text colors, size, and more. For the moment, let’s see how to add a Widget to the Dashboard: click on the button with the + symbol and then on the button with the icon of a sheet. This allows us to create and add a new Widget to the current Dashboard. In this case, too, we select an analog indicator and, in particular, the one with the °C symbol. As soon as we click on the Widget, we will be proposed to define from which data source (device) we have to draw for the data to be displayed; we are also reminded that it is possible to use only one data source.
Then type the Name “RFM69_1” in the field “Alias Entity” then click on “time series” (Fig. 9 and Fig. 10) and we will see the list of all the types of telemetric data measured by the RFM69_1 Sensor; in this section, we select the time series T. Here, too, we are reminded that you can only use one time series. In the end, click on “ADD” and the new Widget will be added to our Dashboard (Fig. 11). We can repeat the procedure to display in the Dashboard also the RSS signal level and the BAT battery charge. Of course, we are free to use other types of Widgets.

Fig. 9

Fig. 10

Fig. 11
Simplify the management
The Dashboard we have sketched will display the data of a single Antennino device. Let’s imagine having tens if not hundreds of sensors sending telemetry data to our ThingsBoard Dashboard and having to repeat for each of the devices the procedure just described; it would be tedious to repeat the various steps for each sensor. Also, keeping all the Dashboards aligned would be a truly thankless task and prone to editing errors.
Let’s also suppose we have developed the system for a customer, who asks us to change the type of Widget used to display the telemetric temperature data of all the sensors, instead of a circular indicator, now wants a linear indicator. All right, we should edit the Dashboard of all the various sensors one by one. A true delirium! But ThingsBoard has the solution for us. You can use a particular type of widget that lists all devices in tabular form. When we add a new device to the network, it will automatically appear in the table. Clicking on a row in the table will open another Dashboard that we can edit at our pleasure, which will display the telemetry data of the device we have selected. So, we’ll only have to make one Dashboard that will display the data of all the devices uniformly. Any change requests from our customer can now be accepted and answered with a couple of clicks.
Let’s see how to manage this type of Dashboard: let’s create a new Dashboard, let’s name it for example “DeviceList” and add some Aliases by clicking on the button indicated by the arrow in Fig. 12. Let’s now open a small parenthesis on Aliases, which are “Placeholders” to indicate device aggregates: for example, a series of devices that meet a particular criterion and that can be used to display data. The first alias we are going to create will be indicated with “AntenninoDevices”; the creation is done through the Add alias dialog box visible in Fig. 13. It is therefore clear that this Alias represents practically all the RFM69 devices that are part of our network. Then we go to create another Alias that we indicate as “CurrentDevice”; this Alias, instead, impersonates the current device that we will select when we click on a row in the table.
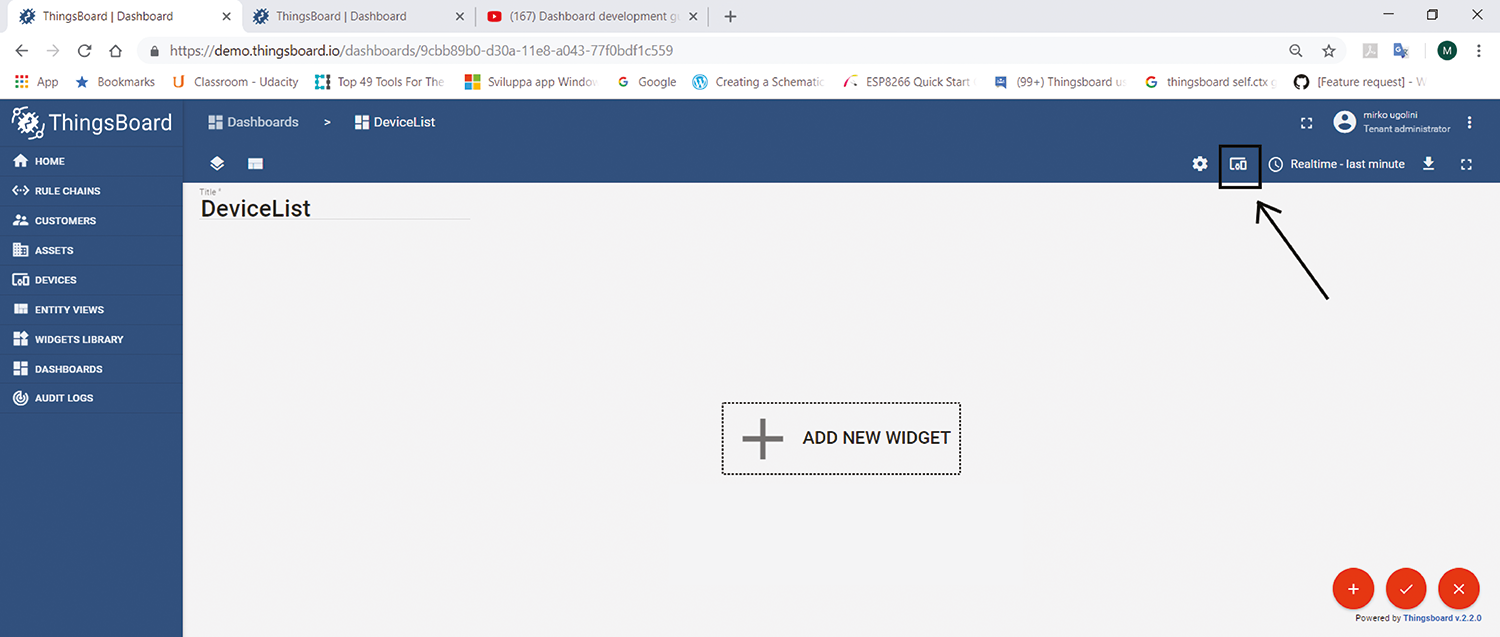
Fig. 12

Fig. 13
In the end, we will find ourselves in a situation like the one in Fig. 14. Click on the “SAVE” button; the Aliases visible in the window will be used in the Widgets we are going to insert; add a Widget of the “Cards” type, select the “LATEST VALUE” Tab, and as soon as we have clicked on the Widget, the mask will appear with the request to define the data source.
We insert as Entity alias, aka “AntenninoDevices,” then click on Timeseries to select the data to display in the table. Only one piece of data would be enough, but let’s take advantage of the tabular view to get an overview of the data coming from the sensors.

Fig. 14
Now let’s open the “ACTIONS” Tab where, clicking on the + button to add an action, we open the proposed tab in Fig. 15 where we select “On row click” on Action source, insert “getDetails” in Name, select “Navigate to new dashboard state” in Type, and check “Set entity from Widget” and then click on “ADD.” Now let’s click on the “Manage Dashboard State” icon, and in the dialog box that opens, we’ll add the two lines present in Fig. 16, clicking on the + button and filling in the relative insertion mask; at the end, we’ll click on “SAVE.”

Fig. 15

Fig. 16
Now let’s go to define the Dashboard that will be displayed when we click on a row in the table: for this purpose, we click on the selector indicated by the arrow in Fig. 17, which will open a new Dashboard “nodedetail” where we are going to insert, for example, an analog indicator as done in the previous examples. After selecting the Widget, we have to define the data source: Entity alias, we select “CurrentDevice,” and then we have to define the TimeSeries. Note that in the relative section we will not have the automatic completion clicking on the wording; then we write T, it will be displayed the wording ‘T‘ not found, create new one: click on ‘create new on’ or Enter, then complete the definition of the data of the Widget clicking on “ADD,” at the end, we will have the Dashboard of Fig. 18 containing the Widget created. Then click on the orange button at the bottom right with the checkmark “Apply changes” to apply the changes.
Now we can test the practicality of what we have implemented: the main window of ThingsBoard shows the table with the list of all the RFM69 devices we have in our network, and the live status of the corresponding telemetry data is displayed. If we click anywhere on a line, we will immediately switch to the Dashboard for the corresponding device. Please note that clicking on “DeviceList” will return you to the table view.

Fig. 17

Fig. 18
Custom widget
We have developed Widgets to interface with Antennino modules, one of them is CUSTOM GPIO, so we open the Widget folder, click on the + button to add a Widget and then on the up arrow icon “Import Widget Bundle” and when the import window opens we select the custom_gpio.json file from the folder you downloaded from our Github repository (https://github.com/open-electronics/antennino). After the import, we will have a new Widget in our “Arsenal” called “Custom GPIO.” The purpose of the Widget we have just inserted is to allow remote control of GPIO PIN on our Antennino module. In our case, we will check the pin of the LED (PIN9) onboard the module, but nobody forbids you to change the code to control another pin-connected, for example, to a relay. So let’s proceed with the insertion of the Widget in the Dashboard that we made in the last example. Open the Dashboard section, double-click on the “DeviceList” Dashboard and enter editing mode. Now click on the selector at the top left and select “nodedetail” in this way, we will edit the detail Dashboard. We will then add a Widget of the type “Custom GPIO” clicking on the + button and then on “create new Widget,” at the end, we will have a situation like Fig. 19.

Fig. 19
Double click on the proposed Widget, and we will be asked (as usual) to specify the data source. Let’s indicate “CurrentDevice” as Data Source, then move to the “ADVANCED” Tab where we will have to leave only one GPIO pin, and the pin must be 9. Click on “ADD” to add the newly configured Widget to the Dashboard; in the end, our Dashboard will be enriched with the GIO control. Now let’s complete the NodeDetail Dashboard with more Widgets. We add the display via “Analog Gauge” of the battery level, and brightness, and then we will also insert graphs to display the trend of the parameters over time. The Widgets are highly customizable. In the case of the analog battery level indicator will be possible to define the minimum and maximum value and also the captions with the minimum, maximum, and average value. After inserting the Widgets, remaining in editing mode, we move the Widgets in the way we like: in our case, we placed them all on a line for space reasons, as shown in Fig. 20.

Fig. 20
The last thing we need to do is to add some Widgets to display temporal graphs of the data; then, we enter the editing mode of our Dashboard and insert three Widgets of the type “Chart” – “Timeseries float” (Fig. 21). Again, once the graph has been selected, we will have to define the data source, the legend, the limits of the y-axis values. Finally, the Dashboard, after having repeated the insertion for Temperature, Brightness, and Battery, is complete as in Fig. 22.
All right, now we’re ready to experiment professionally!

Fig. 21

Fig. 22
Restoring a dashboard from json backup files
When you have finished making the Dashboard, and you feel satisfied, or when you feel you need to make some substantial changes that could compromise the functioning of what you have done so far, you should take a break for a coffee and make a backup of your work.
The backup procedure is straightforward. Simply select the list of Dashboards, locate the one that needs to be saved, and then click the down arrow button “Export Dashboard.” This allows you to save the complete Dashboard as a JSON file on our PC. To make it easier for you, we have backed up your Widget and Dashboard configurations. Then access the project on Github and download the zip containing the necessary files. Once you have unpacked the folder on your PC, among the many folders, you will find one called ThingsBoard in which there are other subfolders: Widgets and Dashboard. Inside the Dashboard, you will find the devicelist.json file.
Our suggestion is to try to create the Dashboard yourself by following the instructions given in the previous paragraph. Still, if you encounter any difficulties, you can create it by restoring it from your backup. Again, the procedure is effortless. Open the page related to the Dashboards and find the orange button with the + symbol: clicking on it, you will see two more buttons; click on the upper one with the up arrow and a central box will appear (Fig. 23) where you will be asked to drag on the dotted area or double click on it to import the JSON file of a previously saved Dashboard.

Fig. 23
Then locate the devicelist.json file in your PC and click on the “IMPORT” button. If you are asked to configure the Gateway alias, click on the button with the pencil, when the proposed window in Fig. 24 will open, in which you will fill in as shown in the figure and then save. If all goes well, you’ll have your Dashboard ready for use.

Fig. 24
Conclusion
Well, we’re done for the moment. Get familiar with ThingsBoard, and if you are not intimidated by English, take time to read the guides on the official website. There are many things to learn and experience. Soon we will explain how to use ThingsBoard in a Multi-Tenant and Multi-Client environment; we will introduce the attributes assignable to ThingsBoard objects and the alarm management with an additional Widget developed by us that will allow us to manage the alarm thresholds of individual devices graphically, without having to write code. We will also see how to send push notifications to an Android device or how to send emails when an alarm condition occurs.
From openstore
ANTENNINO – Arduino-RF multifunction board
ESP-WROOM-32 ESP32 ESP-32S Development Board
Breakout Board with RFM69 (434 MHz)
DC/DC Power Converter 1.5V ÷ 35V / 3A
