- Building a 3D Digital Clock with ArduinoPosted 3 months ago
- Creating a controller for Minecraft with realistic body movements using ArduinoPosted 4 months ago
- Snowflake with ArduinoPosted 4 months ago
- Holographic Christmas TreePosted 4 months ago
- Segstick: Build Your Own Self-Balancing Vehicle in Just 2 Days with ArduinoPosted 5 months ago
- ZSWatch: An Open-Source Smartwatch Project Based on the Zephyr Operating SystemPosted 6 months ago
- What is IoT and which devices to usePosted 6 months ago
- Maker Faire Rome Unveils Thrilling “Padel Smash Future” Pavilion for Sports EnthusiastsPosted 6 months ago
- Make your curtains smartPosted 7 months ago
- Configuring an ESP8266 for Battery PowerPosted 7 months ago
Real-Time Energy Monitor with Arduino and LabVIEW
We present the candidature of Mr. Michele Mancini for the TiDiGino Contest. He proposes us a recent application with Arduino: Real-Time Energy Monitor

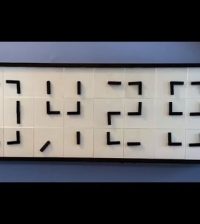
This is a simple power meter to analize the current consuming in a house using the led indicator of a house energy meter.
Reading the red led of a home energy counters the system detects the corrent consumption in a house.
It is a noninvasive method, not cut wire, no current disconnects, so a very interesting method…
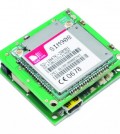
The system consists of two parts: the Arduino board that detects the led pulses and sends the data via the XBee module, and a PC that recive the data through a USB/Xbee module and processes the data with LabVIEW so you can prepare and study the consumption in a very instant.
Arduino sends two datas to the PC:
1 – Real time datas
2 – Average consumption measured in a time of 5 minutes.

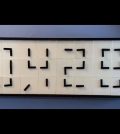
From the picture we see that the LED that indicates the current consumption is the red LED near to the display. In particular is the LED superior.
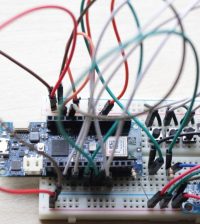
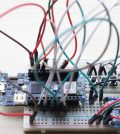
Arduino module
To detect the LED blinking you have to apply a simple photoresistor above the led and covered it with black tape. To read the analog voltage using the Arduino you have to use a resistive divider as shown in diagram:

The LED blinking causes the voltage drop down and this value is read by Arduino and compared with the voltage acquired by the potentiometer connected in the channel A0. This potentiometer has the task to adjust the sensitivity threshold.
The read data are processed from the sketch and then sends to the PC via Xbee module.
The Arduino code acquisition is as follows:
   delay(10); //10ms
   val_pot = analogRead(POT);
   delay(10); //10ms
   val_sensore = analogRead(SENSORE);
  if((val_sensore > val_pot)&(flag_acquire == 0)){
      flag_acquire = 1;
      digitalWrite(LED, LOW);
With this code Arduino acquires the two voltages, the photoresistor voltage compared with the voltage of the potentiometer, if the value is greater than the sketch actives the flag “flag_acquire = 1”, then read how much time has passed to another flash.
To do this use arduino to read a statement in an internal counter that returns the milliseconds since power on. The instruction is “millis ()” code here:
pre_tmS = cur_tmS;
      cur_tmS = millis();
      if( cur_tmS > pre_tmS ) {
        tm_diffS = cur_tmS – pre_tmS;
     }
There are 2 variables pre_tmS and cur_tmS, “cur_tmS” needs to read the current value of the internal counter: cur_tmS = millis (); Then if the condition (cur_tmS> pre_tmS) is true, I note the elapsed time between cycles, ie between the LED ON and the next cycle of the LED ON and write it on the variable “pre_tmS”. Now we have to send to the PC via the serial port using XBee with these instructions:
Serial.print(“S”);
      Serial.println(tm_diffS);
     delay(10); //10ms
First Arduino sends a marker “S” used to labview to recognize that this value is part of the reading that real-time instant, then send the value in milliseconds elapsed. Now you have to reset the flag when the LED goes OFF using this statement:
  if((val_sensore < val_pot)&(flag_acquire == 1)){
      flag_acquire = 0;
     digitalWrite(LED, HIGH);
      impulsi++;
      delay(10); //10ms
  }
You have to check the voltage acquired by the sensor, if it falls below the potentiometer value and the flag is active “flag_acquire == 1” then you have to reset the flag. Note that the statement “impulsi++;” is simply a counter that counts the cycles of the LED power meter, this is to make an average energy consumed every 5 minutes. The third task is similar to the first task, wait 1 second, and increments the counter “time_flag++,” which is the fourth task of counting 300secondi (5 minutes). In addition, this task blinks the LED connected to pin 12 at a rate of 1 second.
The fourth task as mentioned above waiting 5 minutes and then sent via serial marker “L” is used to program labview to recognize that the data sent is the data on the average found in 5 minutes.
The sketch
#define POT 0
#define SENSORE 1
#define LED 13
#define LED1sec 12

// definire il tempo casuale che varia tra 40ms e 250ms
#define TimeAcquire  1000      //1sec
#define Time5Minuts  300      //5 minuti = 300sec

unsigned long cur_tm = millis();
unsigned long pre_tm = cur_tm;
unsigned int tm_diff = 0;

unsigned long cur_tmS = millis();
unsigned long pre_tmS = cur_tmS;
unsigned int tm_diffS = 0;

unsigned int time_flag=0;

unsigned int impulsi=0;
unsigned int val_pot=0;
unsigned int val_sensore=0;
char flag_acquire=0;
char flag_time=0;

void setup() {

  pinMode(LED, OUTPUT);
  pinMode(LED1sec, OUTPUT);
  Serial.begin(115200);          //  setup serial 115200
  Serial.println("ENEL KW/h reader!");

}

void loop() {

  //Acquisisco
   delay(10); //10ms
   val_pot = analogRead(POT);    // read the input pin
   delay(10); //10ms
   val_sensore = analogRead(SENSORE);    // read the input pin

  if((val_sensore > val_pot)&(flag_acquire == 0)){
      flag_acquire = 1;
      digitalWrite(LED, LOW);

      pre_tmS = cur_tmS;
      cur_tmS = millis();
      if( cur_tmS > pre_tmS ) {
        tm_diffS = cur_tmS - pre_tmS;
      }
      Serial.print("S");
      Serial.println(tm_diffS);

      delay(10); //10ms

  }
  if((val_sensore < val_pot)&(flag_acquire == 1)){
      flag_acquire = 0;
      digitalWrite(LED, HIGH);
      impulsi++;          //Incrementa impulsi
      delay(10); //10ms
  }

  //------Ogni 5 minuti invia "impulsi" ----------
  pre_tm = cur_tm;
  cur_tm = millis();
  if( cur_tm > pre_tm ) {
    tm_diff += cur_tm - pre_tm; //+=
  }
  if( tm_diff >= TimeAcquire ) { //Task ogni secondo
    tm_diff = 0;

    time_flag++;

    if(flag_time==0){
      digitalWrite(LED1sec, HIGH);
      flag_time = 1;
    }else{
      digitalWrite(LED1sec, LOW);
      flag_time = 0;
    }

  }

  if(time_flag>=Time5Minuts){
//Sono passati 5 minuti ? ..... Invia "impulsi" rilevati dal contatore
      Serial.print("L");
      Serial.println(impulsi);
      impulsi = 0;
      time_flag = 0;
  }

 //--------------------------------------------------

}
LABVIEW interface
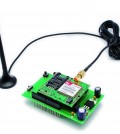
To recive the data we use the XBee UartSbee V3.1 module from Futura Elettronica.

The interface created in LabVIEW is simple to use:

As can be seen from this figure, the top graph shows the average consumption every 5 minutes, while the bottom graph shows the real-time energy consumption. It ‘can save the data using the device as a data logger.
Download
| Arduino Sketch | |
| |
LabVIEW (VI file) |
| |
Schematics (eagle file) |

Related Posts


12 Comments
Leave a Reply
-
 Arduino ISP (In System Programming) and stand-alone circuits
We use an Arduino to program other ATmega without...
- Posted 12 years ago
-
-
-
 GSM GPS shield for Arduino
Shield for Arduino designed and based on the module...
- Posted 12 years ago
-
 Small Breakout for SIM900 GSM Module
Some post ago we presented a PCB to mount...
- Posted 13 years ago
-
 Building a 3D Digital Clock with Arduino
Project to create a digital clock consisting...
- Posted 3 months ago
-
 Acoustic amplifier – in DIY Kit
This kit creates a microphone amplifier with an output...
- Posted 4 months ago
-
 Creating a controller for Minecraft with realistic body movements using Arduino
Project of a controller that maps body movements...
- Posted 4 months ago
-
-
 Holographic Christmas Tree
Beautiful project to create a Persistence of Vision...
- Posted 4 months ago
Pingback: Electronics-Lab.com Blog » Blog Archive » Real-Time Energy Monitor with Arduino and LabVIEW
Pingback: Mesurer et Suivre sa conso électrique
Pingback: Cubietruck | Pearltrees